Due to a ransomware attack, the wiki was reverted to a July 2022 version. . We apologize for the lack of a more recent valid backup.
...
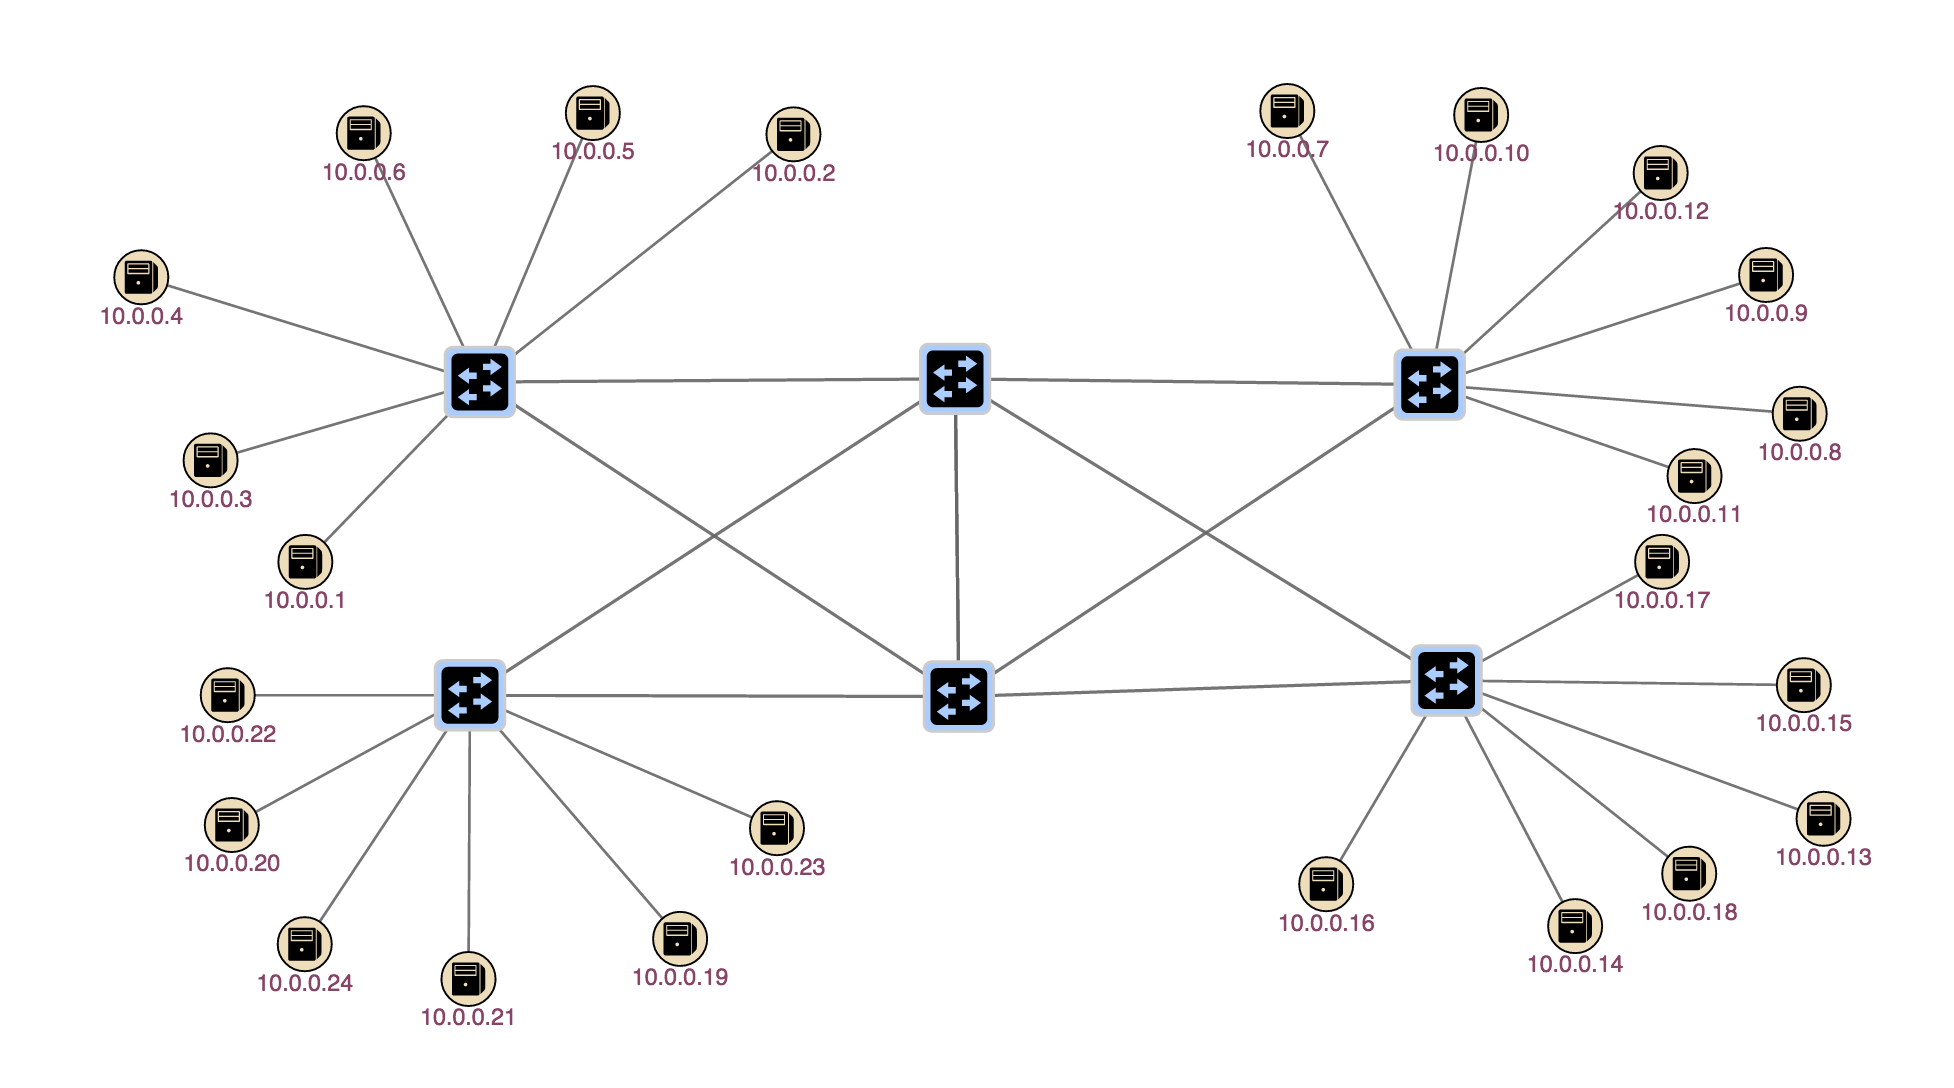
At this point you should see something roughtly similar to the image below.
GUI Features
Summary pane
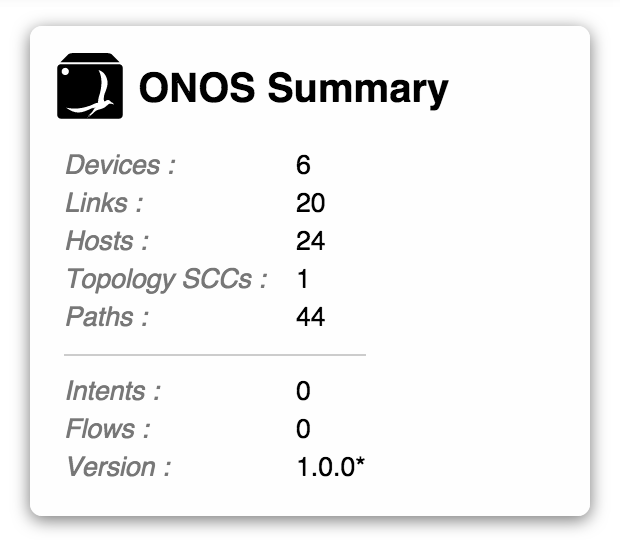
The GUI comes with a very useful summary pane. It shows you a summary of what if going on at this ONOS cluster.
Switch details
When you click on a switch a pane appears on the right hand side. This pane gives information about the switch as shown in the image below.
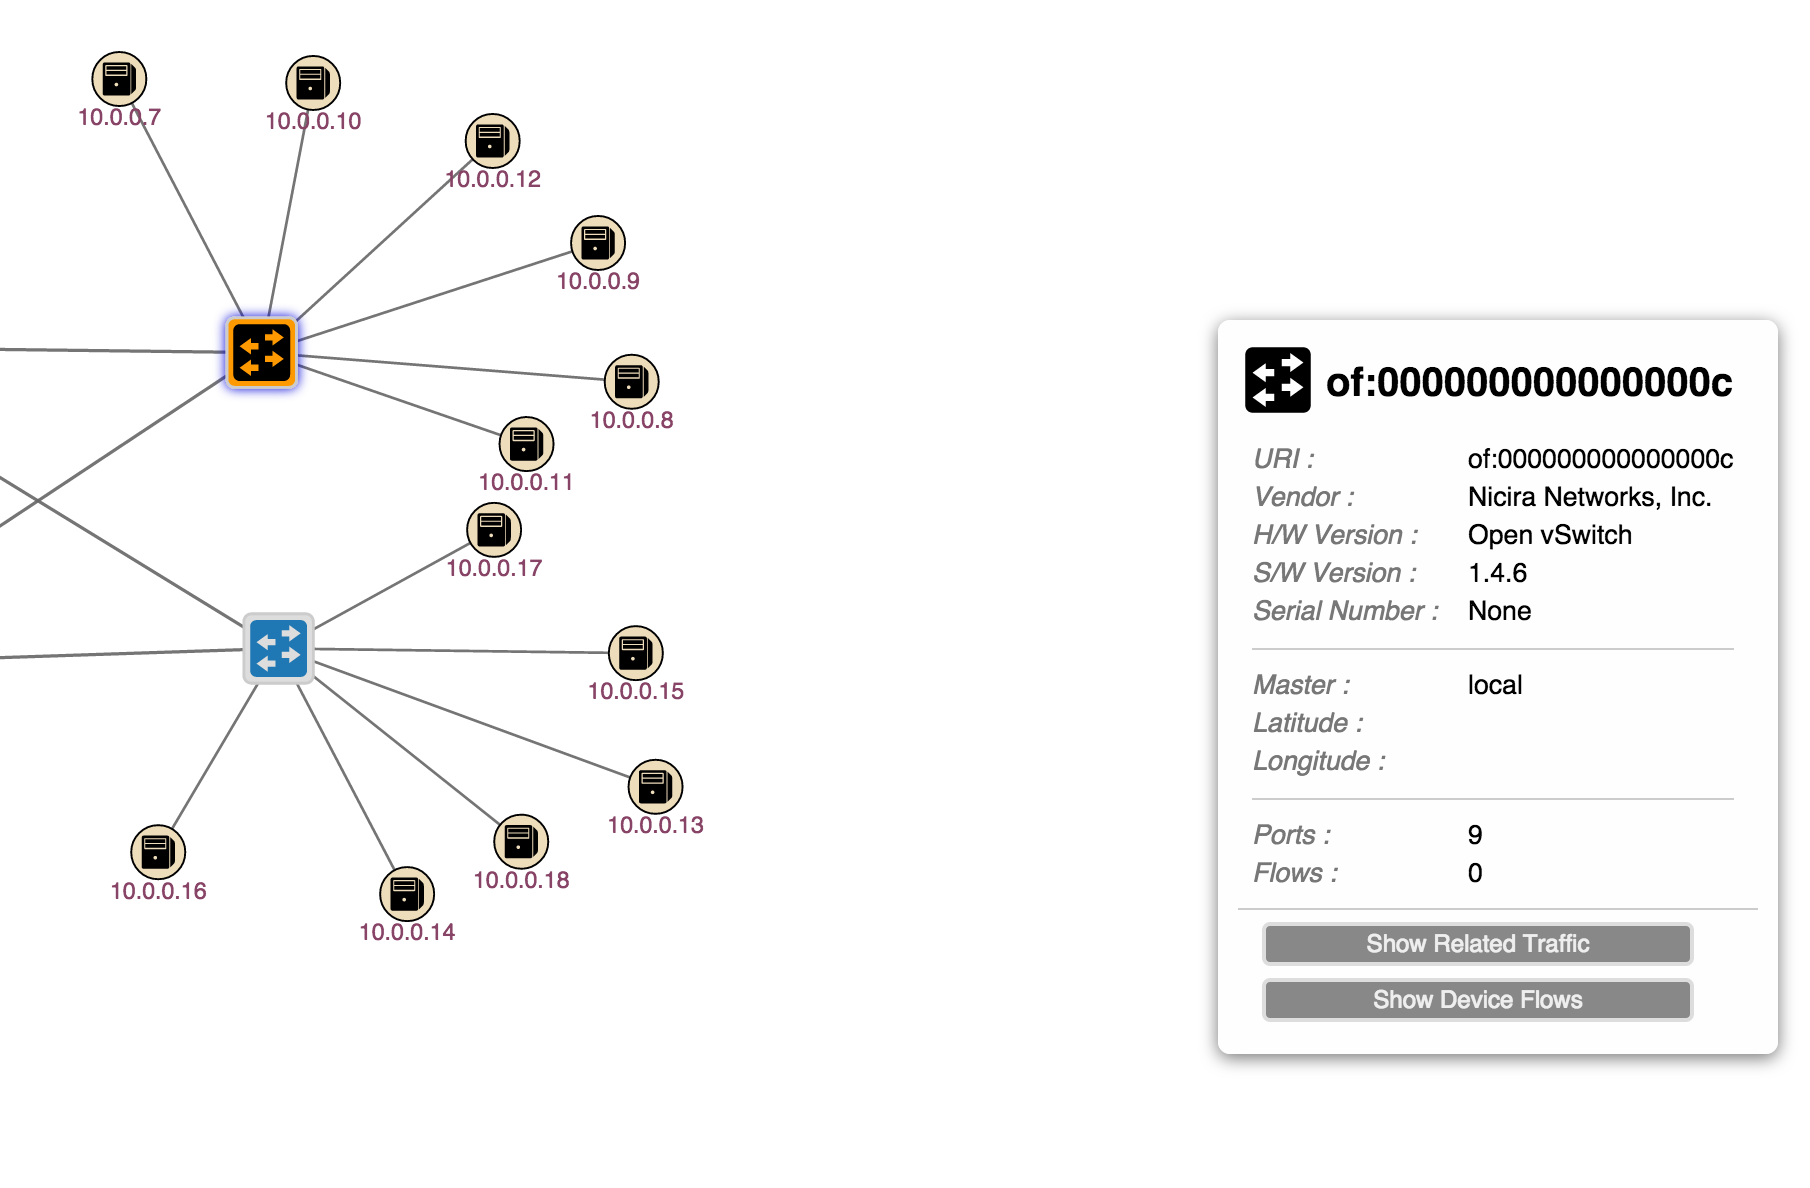
You my notice that the UI reports nine ports but you can only see eight, this is because OpenFlow switches have virtual ports that are hard to show on a UI.
Shift click will unselect the switch and remove the pane
Instances
The GUI has the ability to show which ONOS instances are active. By hitting the 'i' key you will see a pane show up on the left hand side as shown below.
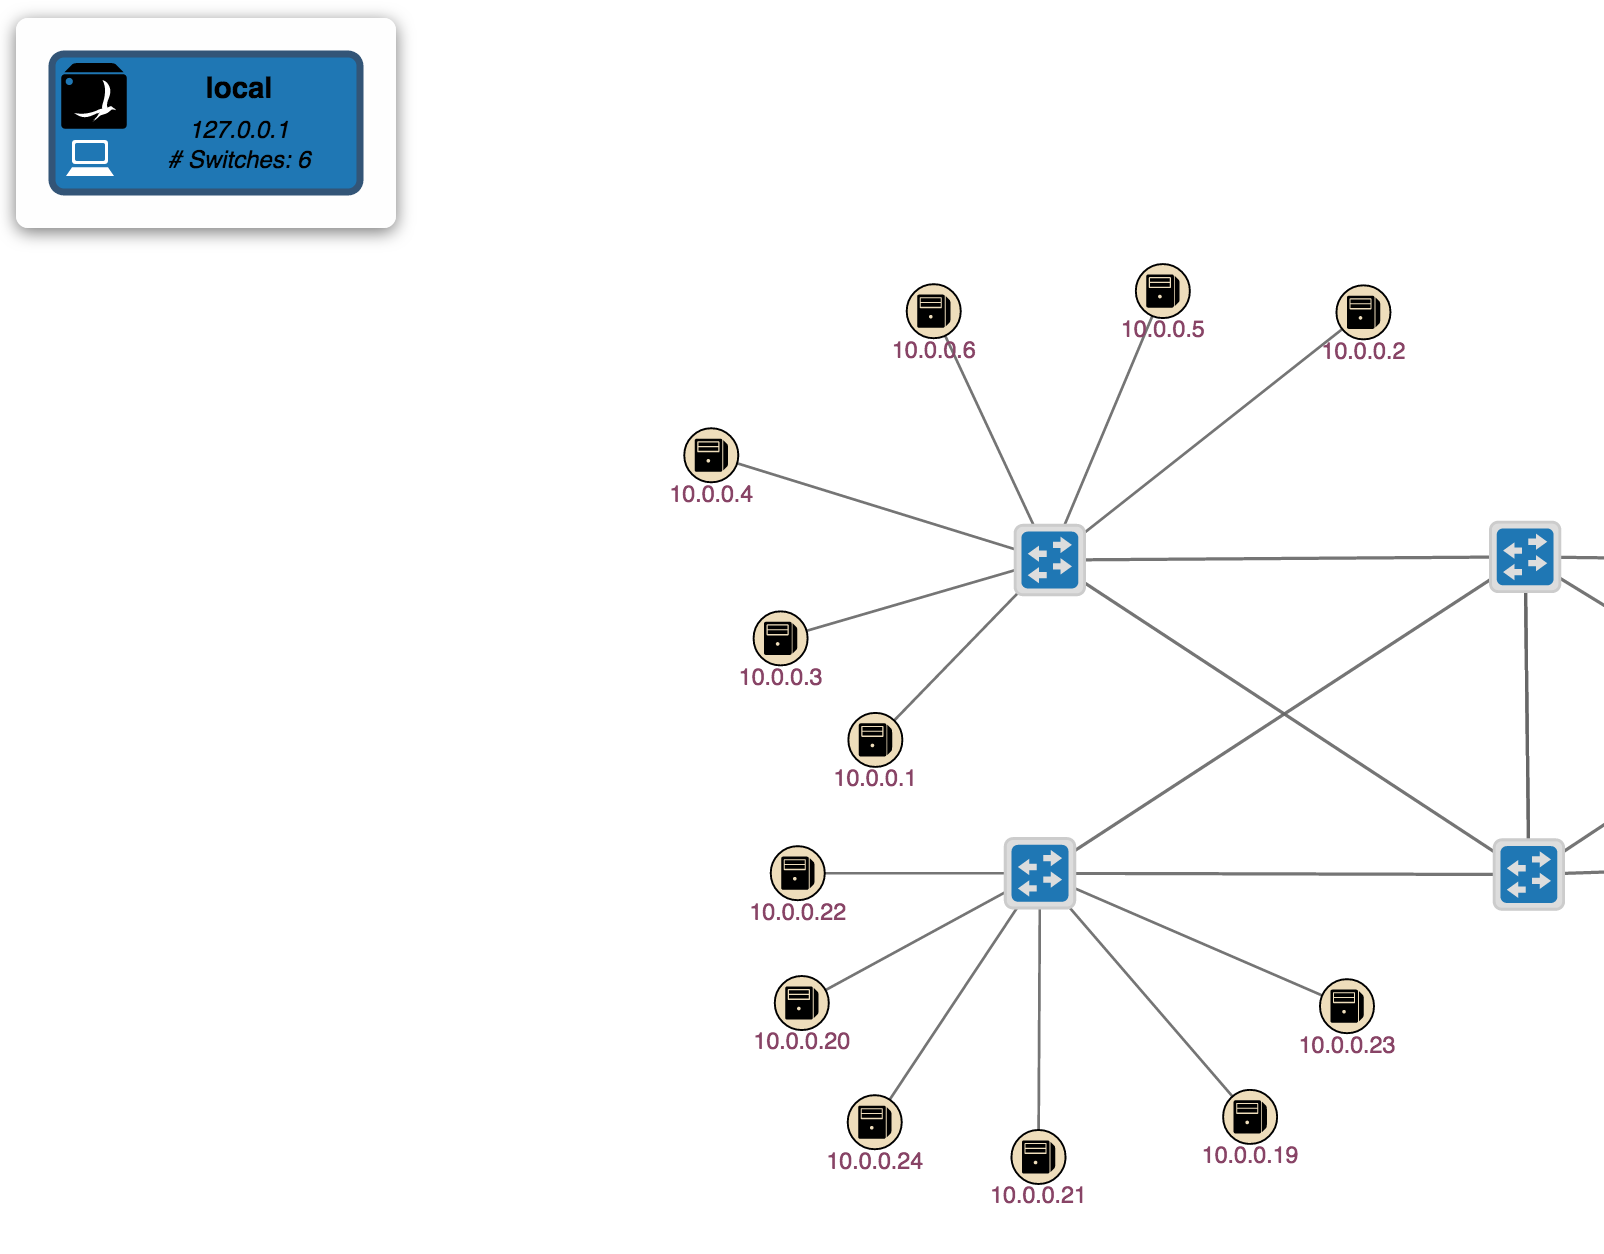
Notice that the glyphs for the switches changes color, this indicates which switches are controlled by which instance. This is useful to see at a glance which switches are controlled by which ONOS instance.
Install Intent
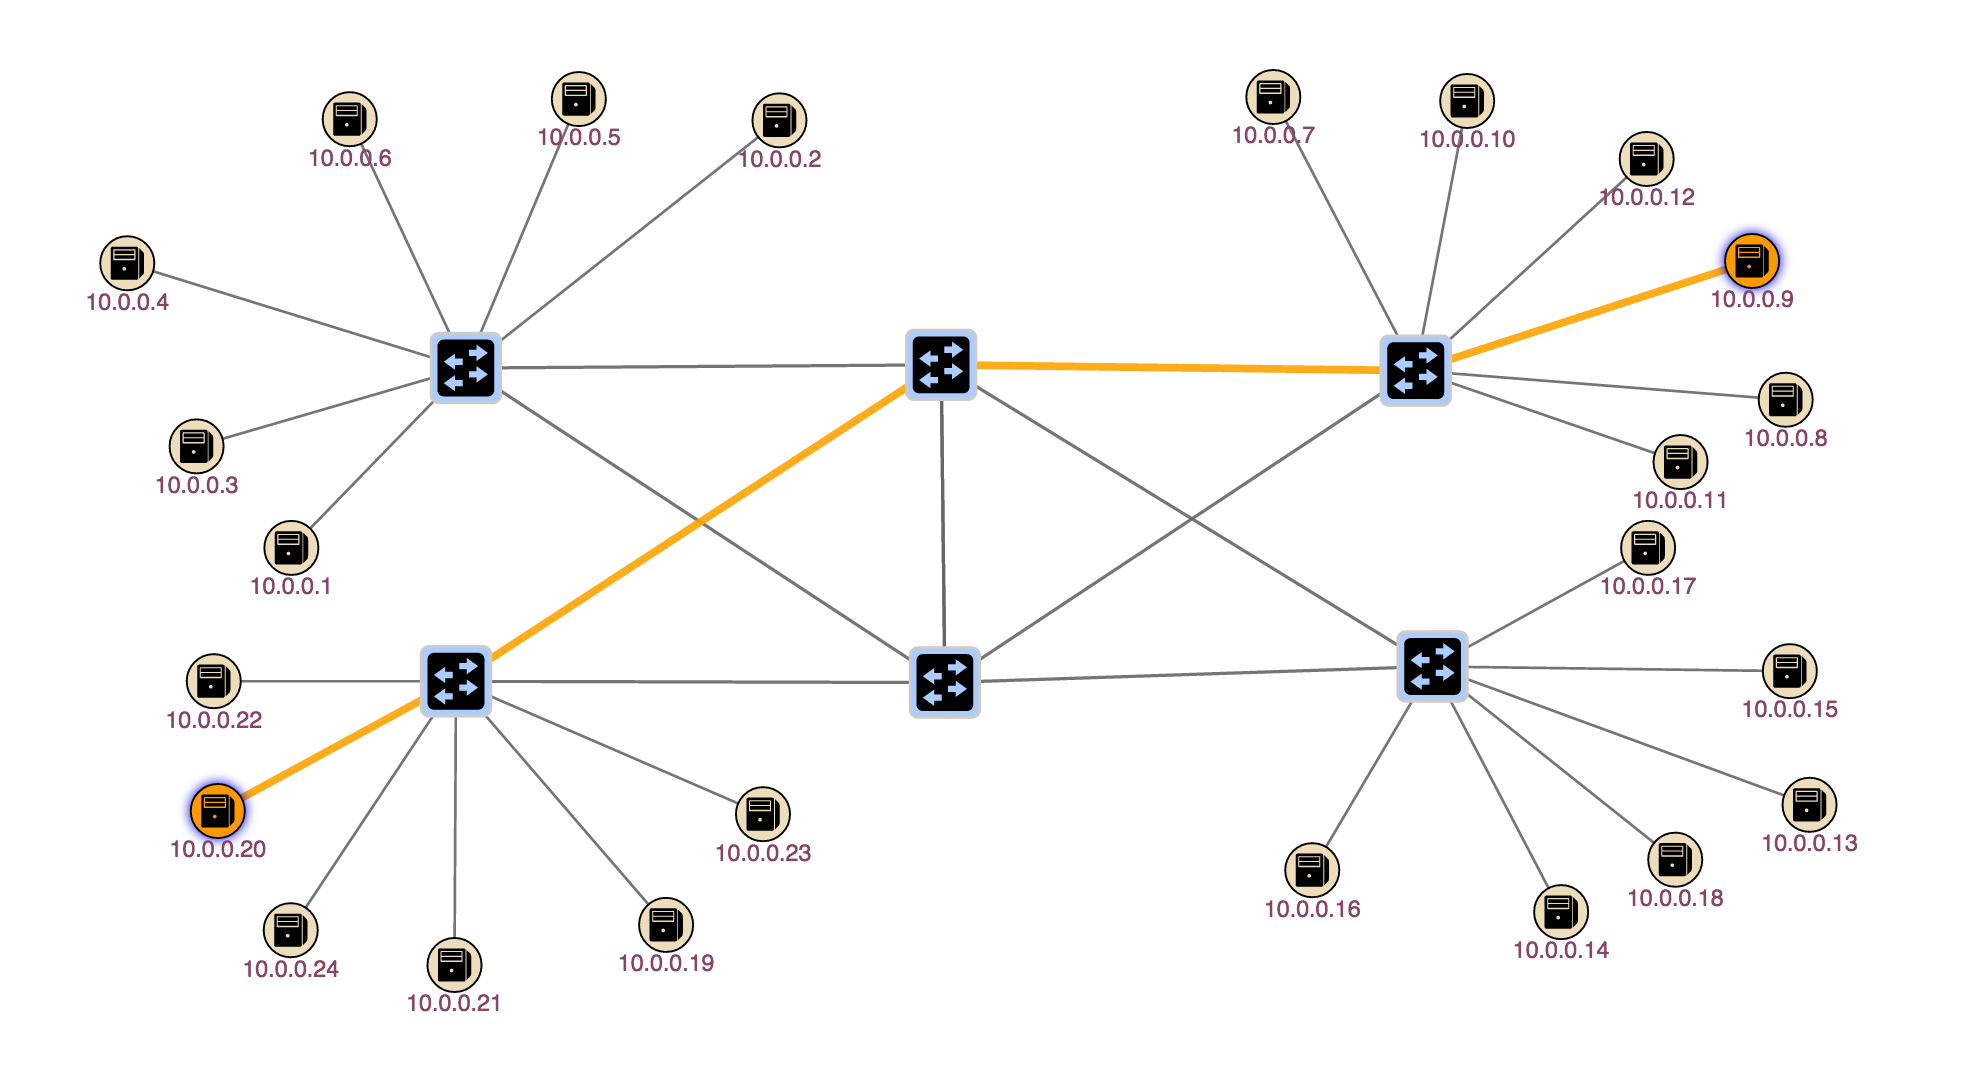
Ok let's install an intent using the UI. First select two hosts by clicking on one host then shift-click on another. Let's pick 10.0.0.20 and 10.0.0.9. Now a pane will appear on the right and side of the screen as here:
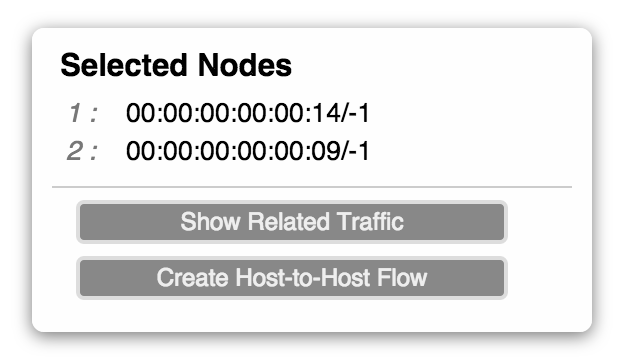
Now click on 'Create Host-to-host Flow', this actually provisions a host to host intent and lights up the path used by the intent.
You can check that the intent was installed via the ONOS cli
| Code Block |
|---|
onos> intents
	id=0x223838ca, state=INSTALLED, type=HostToHostIntent, appId=org.onlab.onos.gui
[LinkTypeConstraint{inclusive=false, types=[OPTICAL]}] |
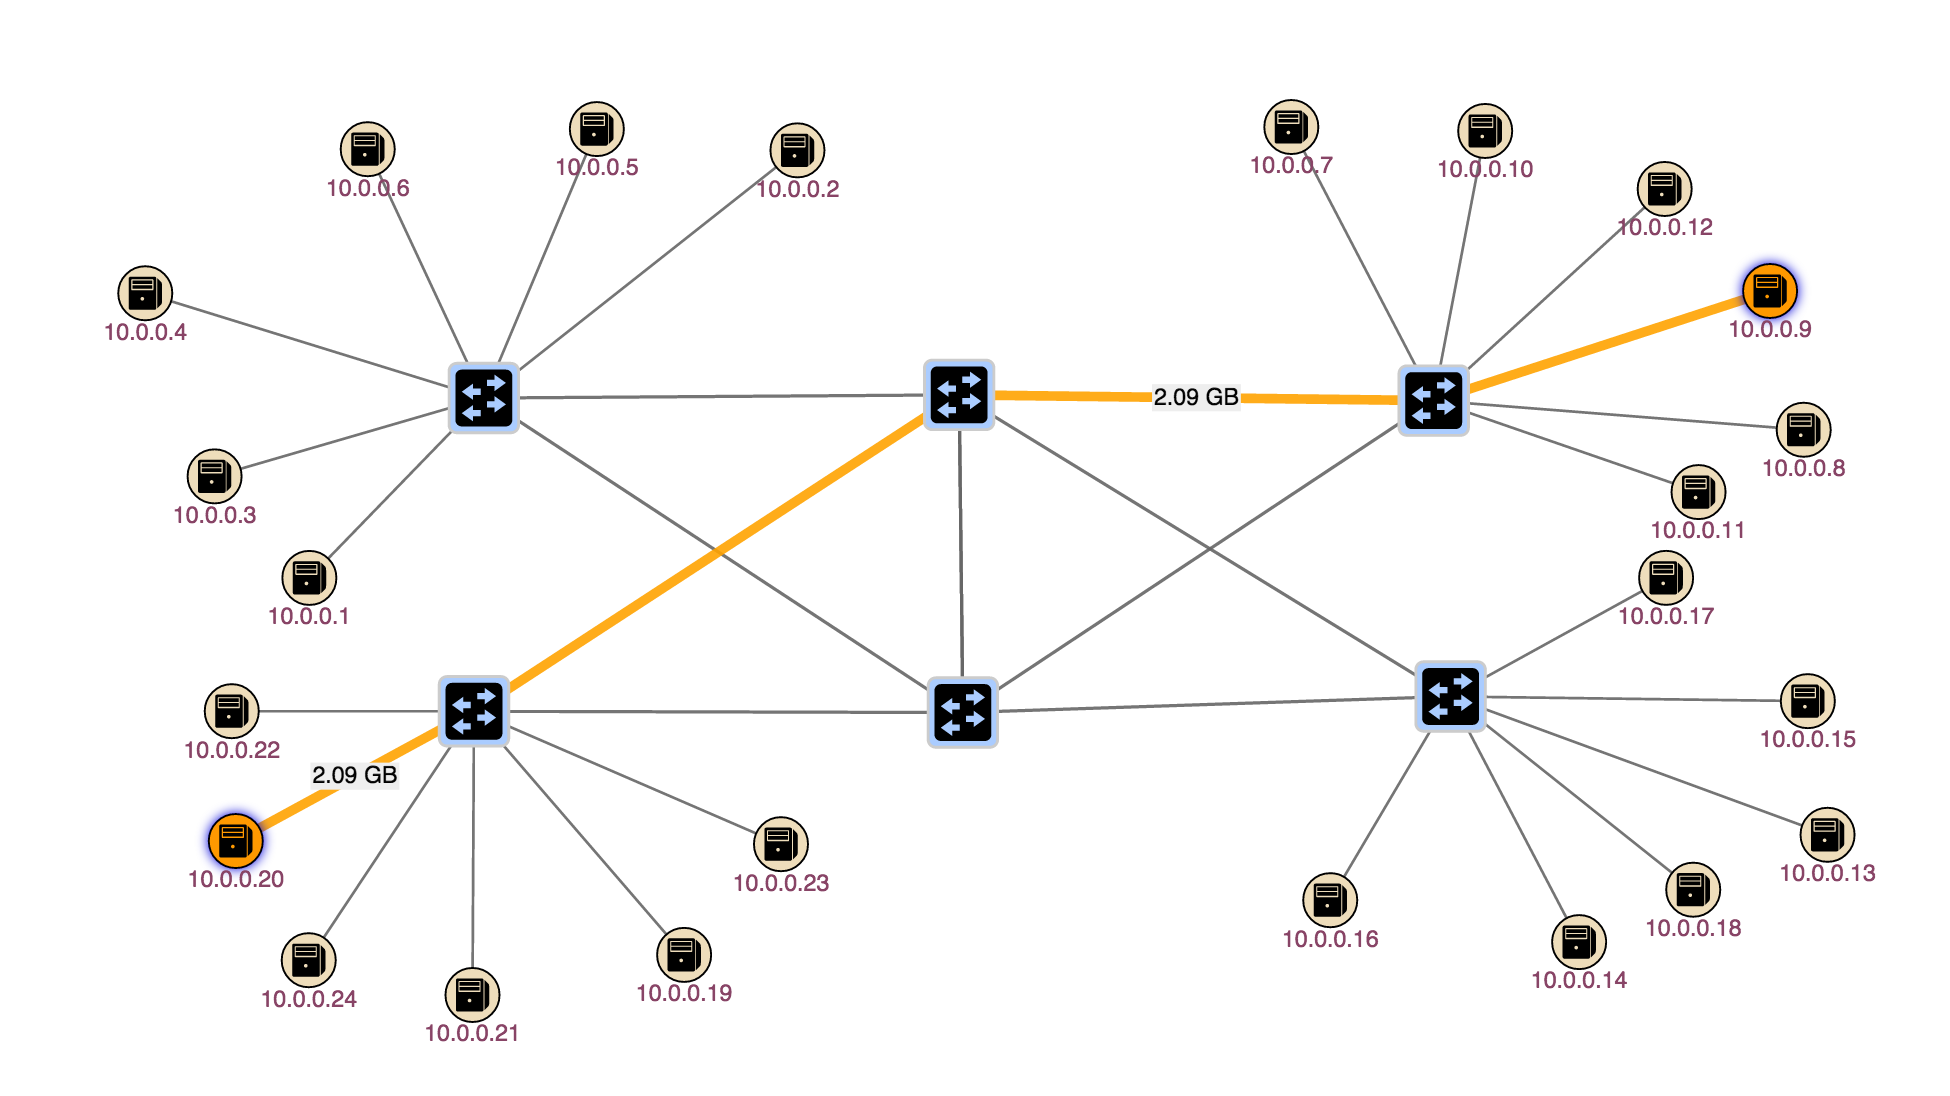
Now let's send some traffic on that intent. This will animate the link to show traffic and display how much traffic (counter value) is flowing through that link
Show all traffic
Another thing you can do is activate the 'All Traffic' mode in the UI. This will show you any traffic that is running on the network. Activate this command by hitting 'a'.