Due to a ransomware attack, the wiki was reverted to a July 2022 version. . We apologize for the lack of a more recent valid backup.
...
The Device View provides a top level listing of the devices in the network. All devices connected to the network are displayed in tabular form.
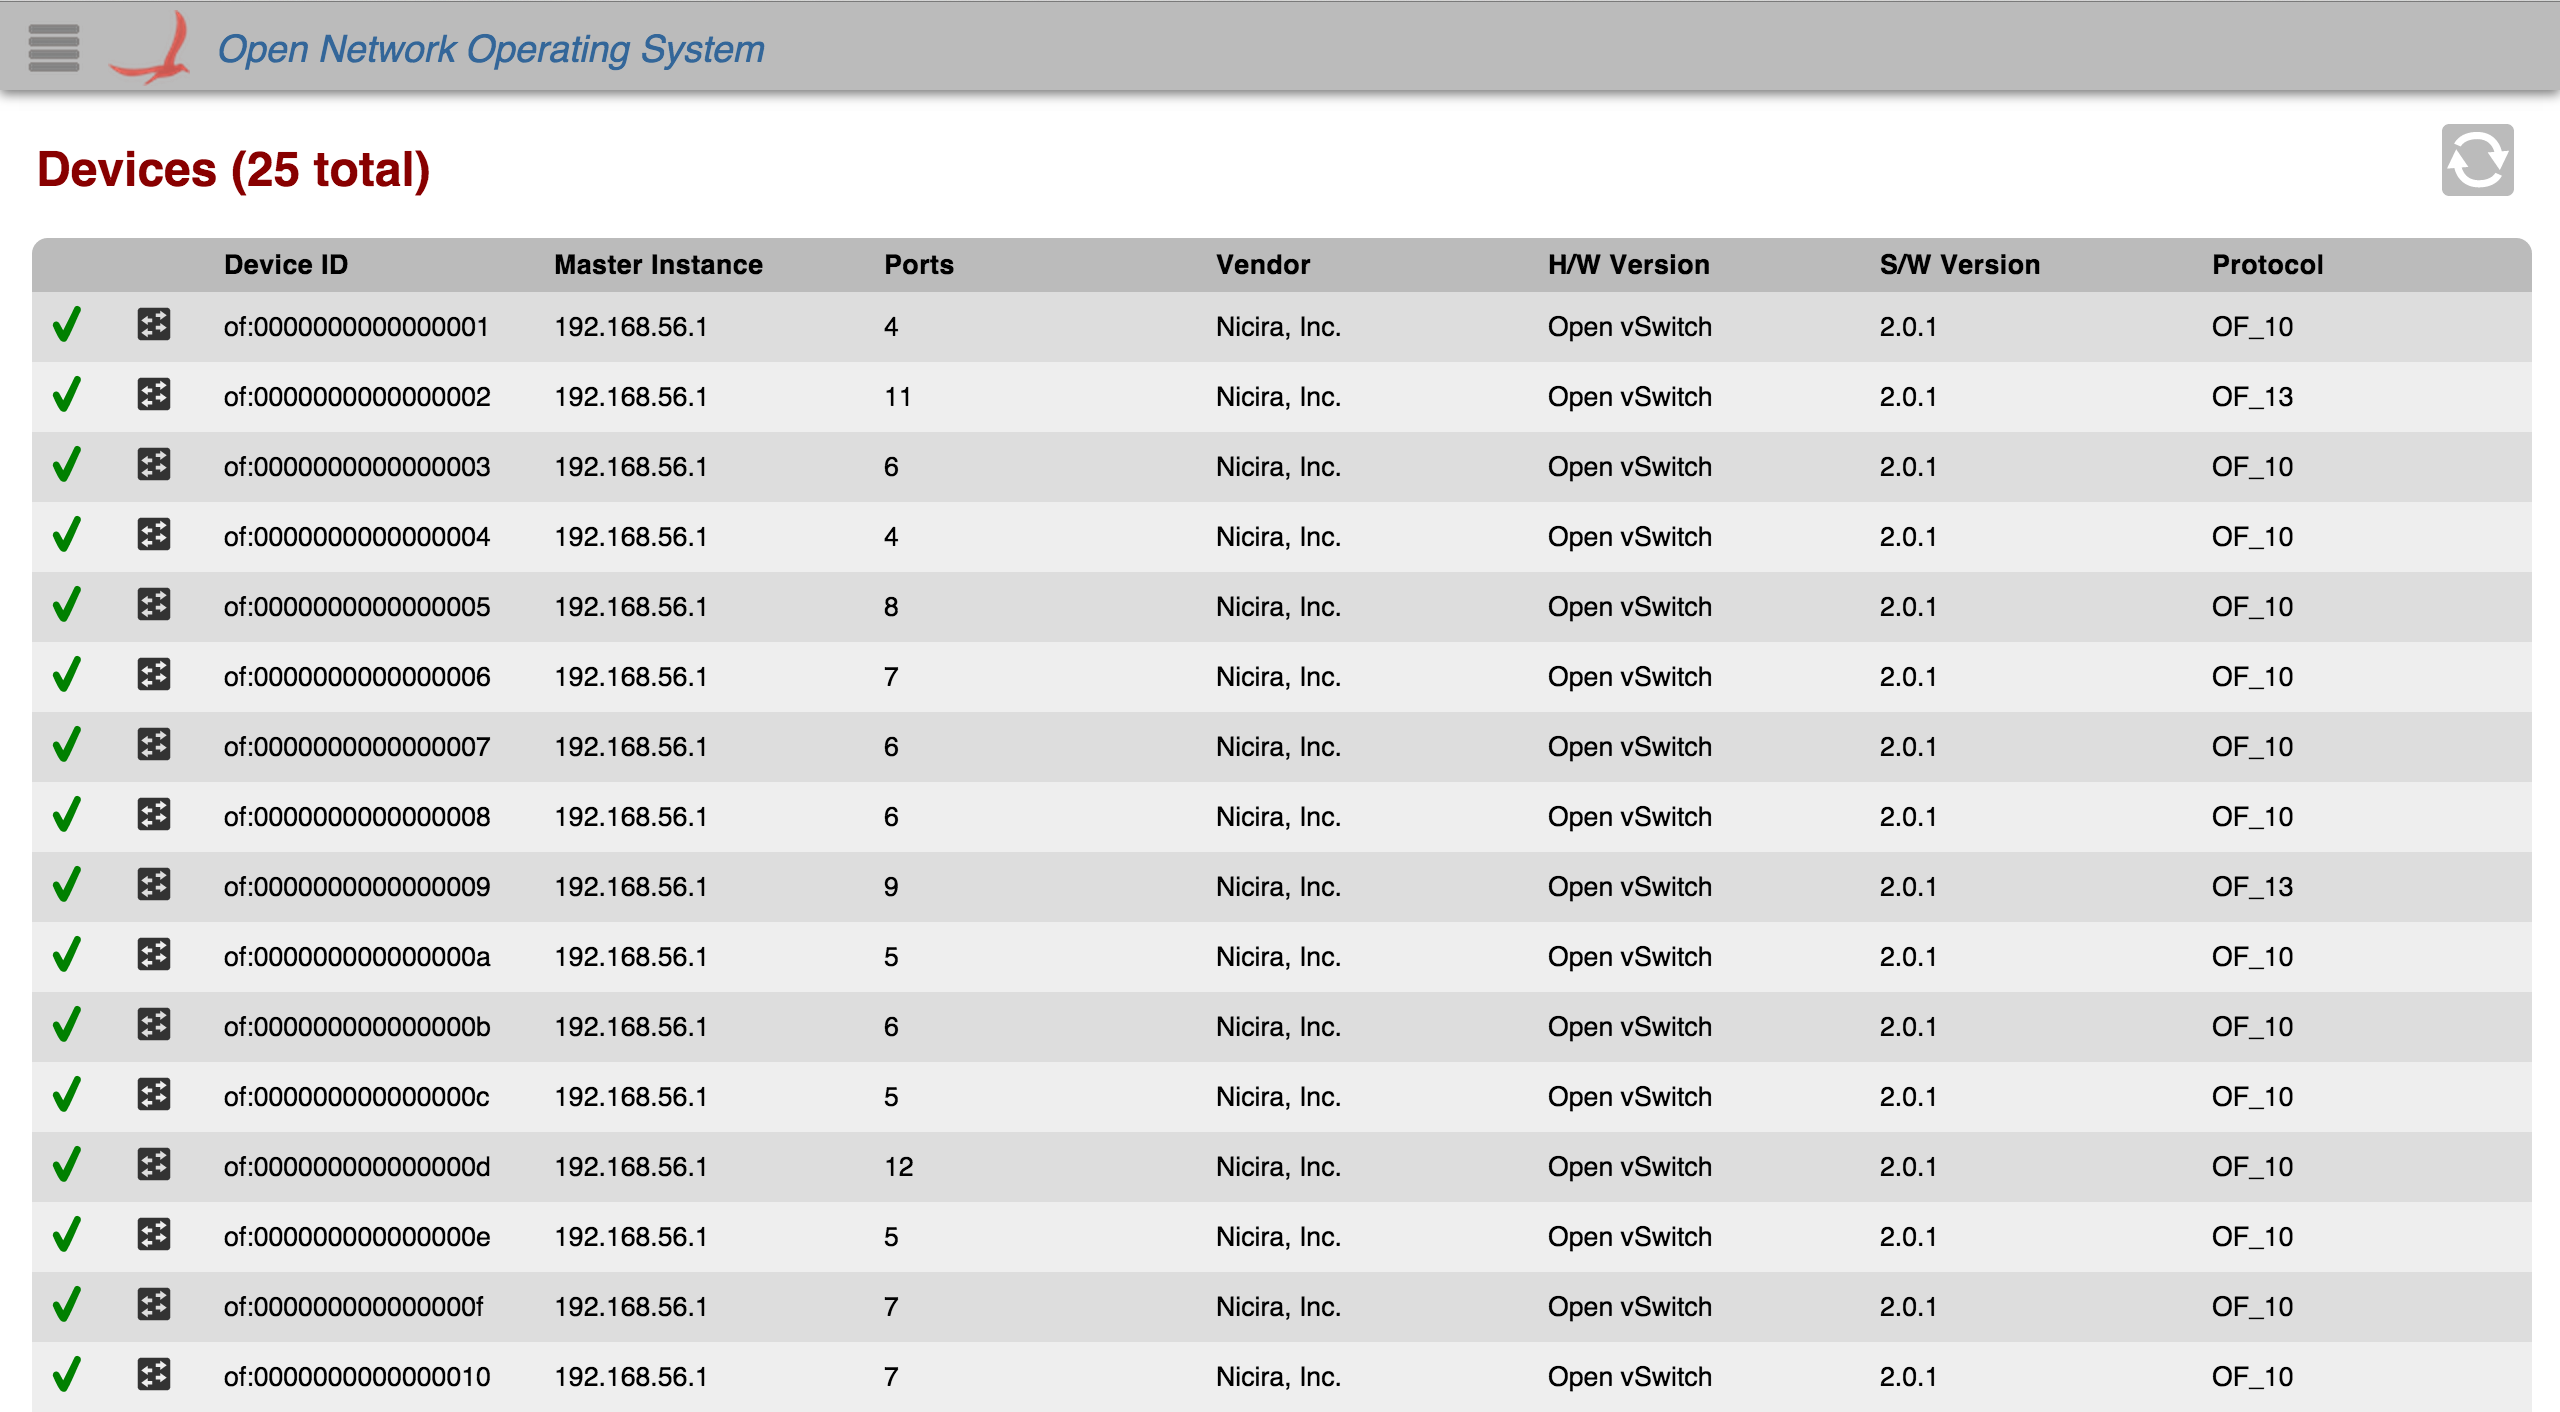
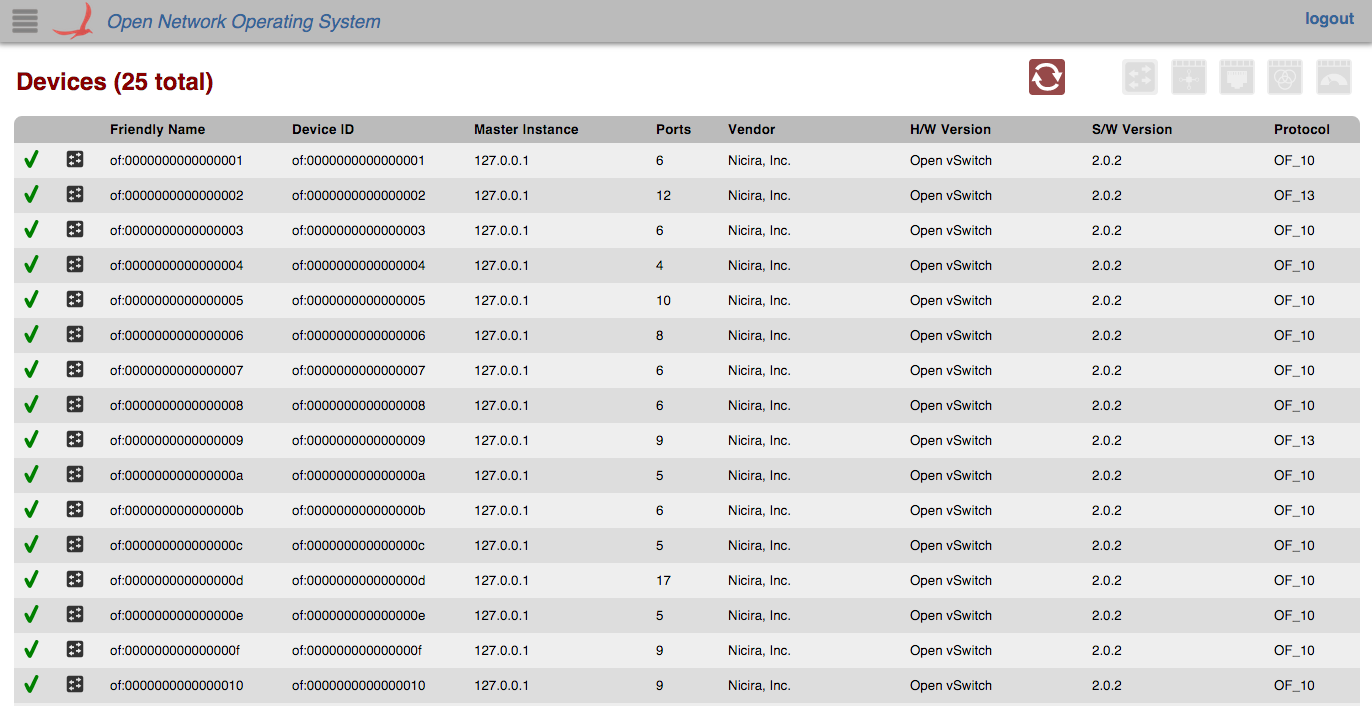
Each row in the table is a single device on the network. To see more devices, scroll down inside the table body.
...
The total number of devices connected (both online and offline) is displayed in the upper left corner.
Control Buttons
Navigation
There are a few buttons in the upper right corner of the Device View that allow you to navigate to associated views. You can only click on these when a device is selected.
 Flow View: Click this to go to the flow view for the selected device.
 Port View: Click this to go to the port view for the selected device.
 Group View: Click this to go to the group view for the selected device.
 Meter View: Click this to go to the meter view for the selected device.
Table Body
Column Headers
...
All rows in the table are selectable. When a device (table row) is clicked on, a details panel about that device will appear on the right edge of the screen with more detailed information about the device.
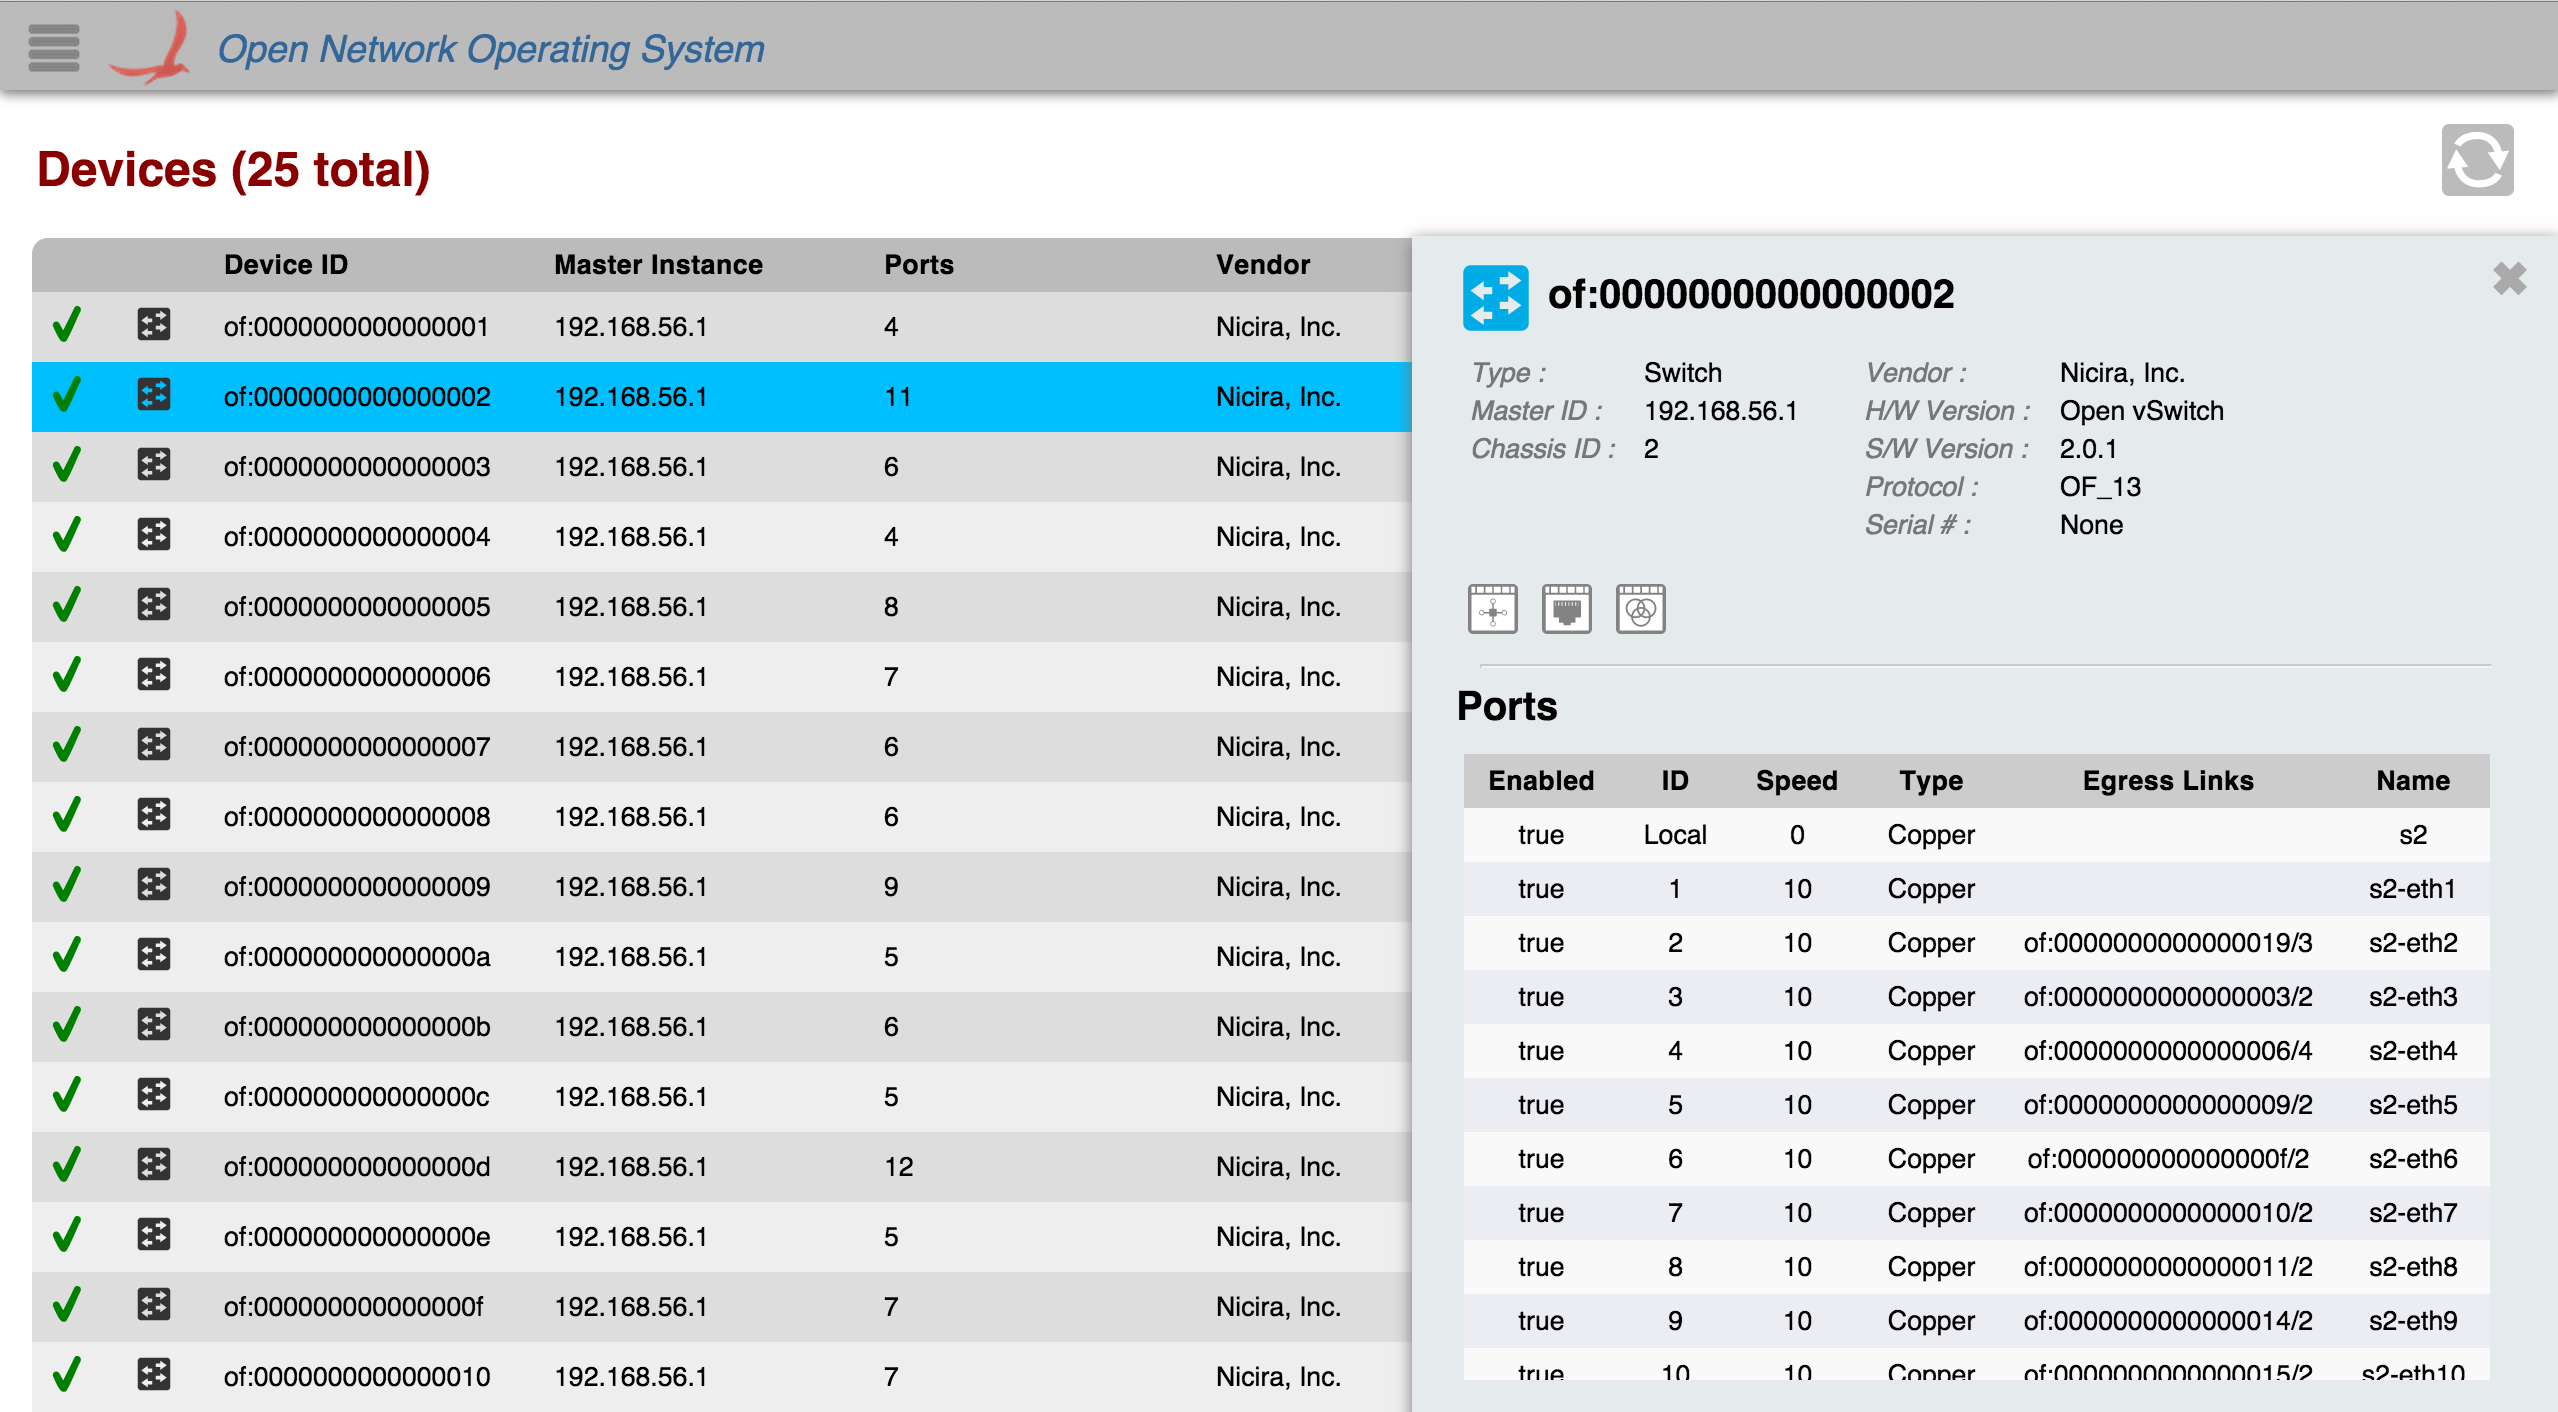
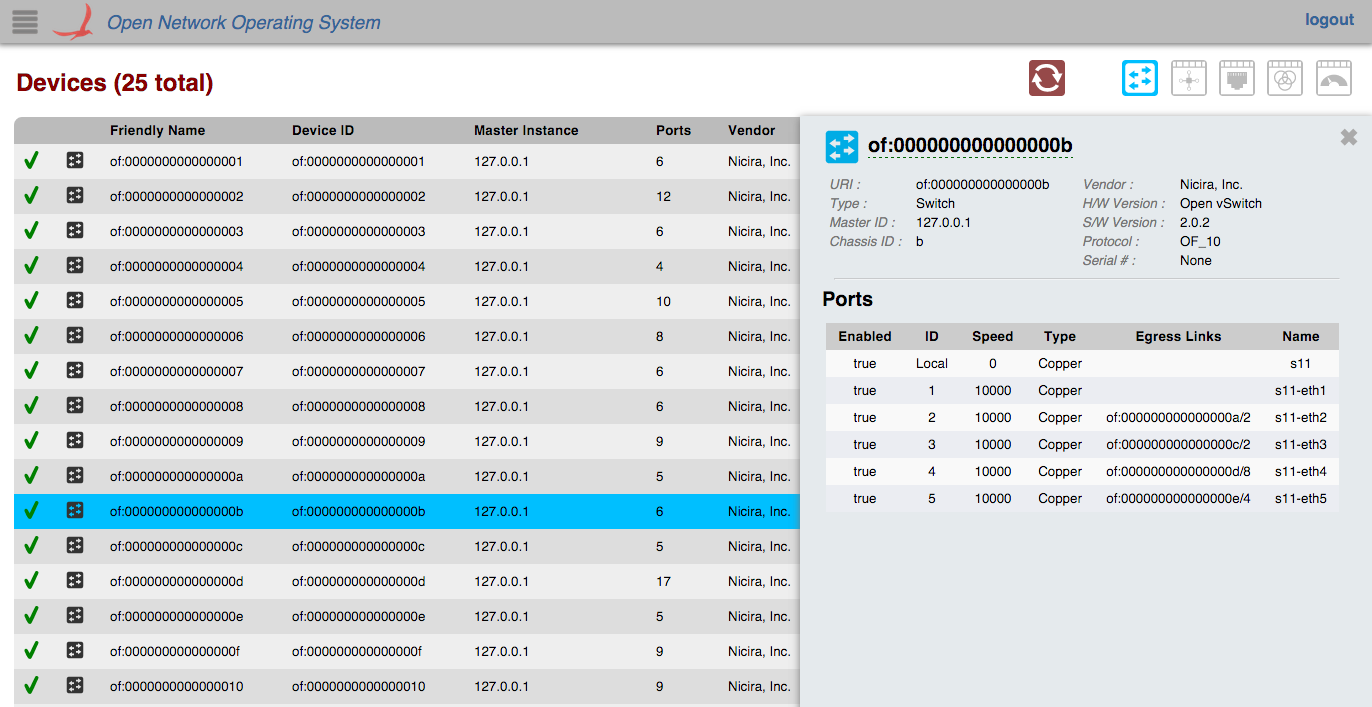
You can close the panel by deselecting the table row (clicking on the same device again), or by clicking on the 'X' in the upper right corner of the panel.
...
The table of ports inside the panel is scrollable but it is not sortable. This table will be expanded on in future releases.
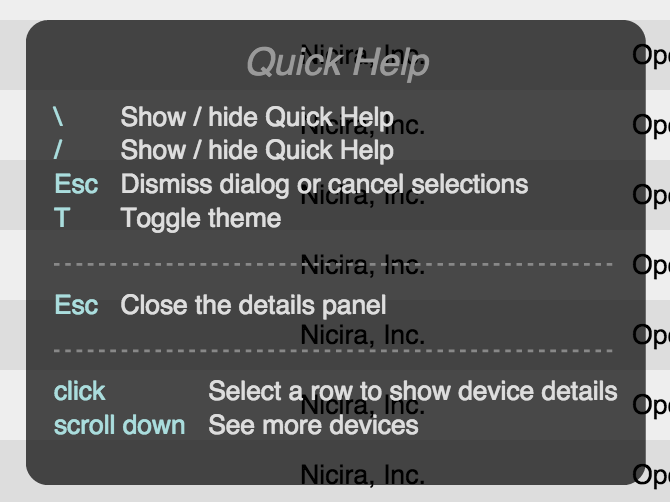
Quick Help
You can press the '/' or '\' key to bring up the Quick Help Panel which lists actions you can use on the view.