Due to a ransomware attack, the wiki was reverted to a July 2022 version. . We apologize for the lack of a more recent valid backup.
...
The Device View provides a top level listing of the devices in the network. All devices connected to the network are displayed in tabular form. (This view will be expanded on in future releases.)
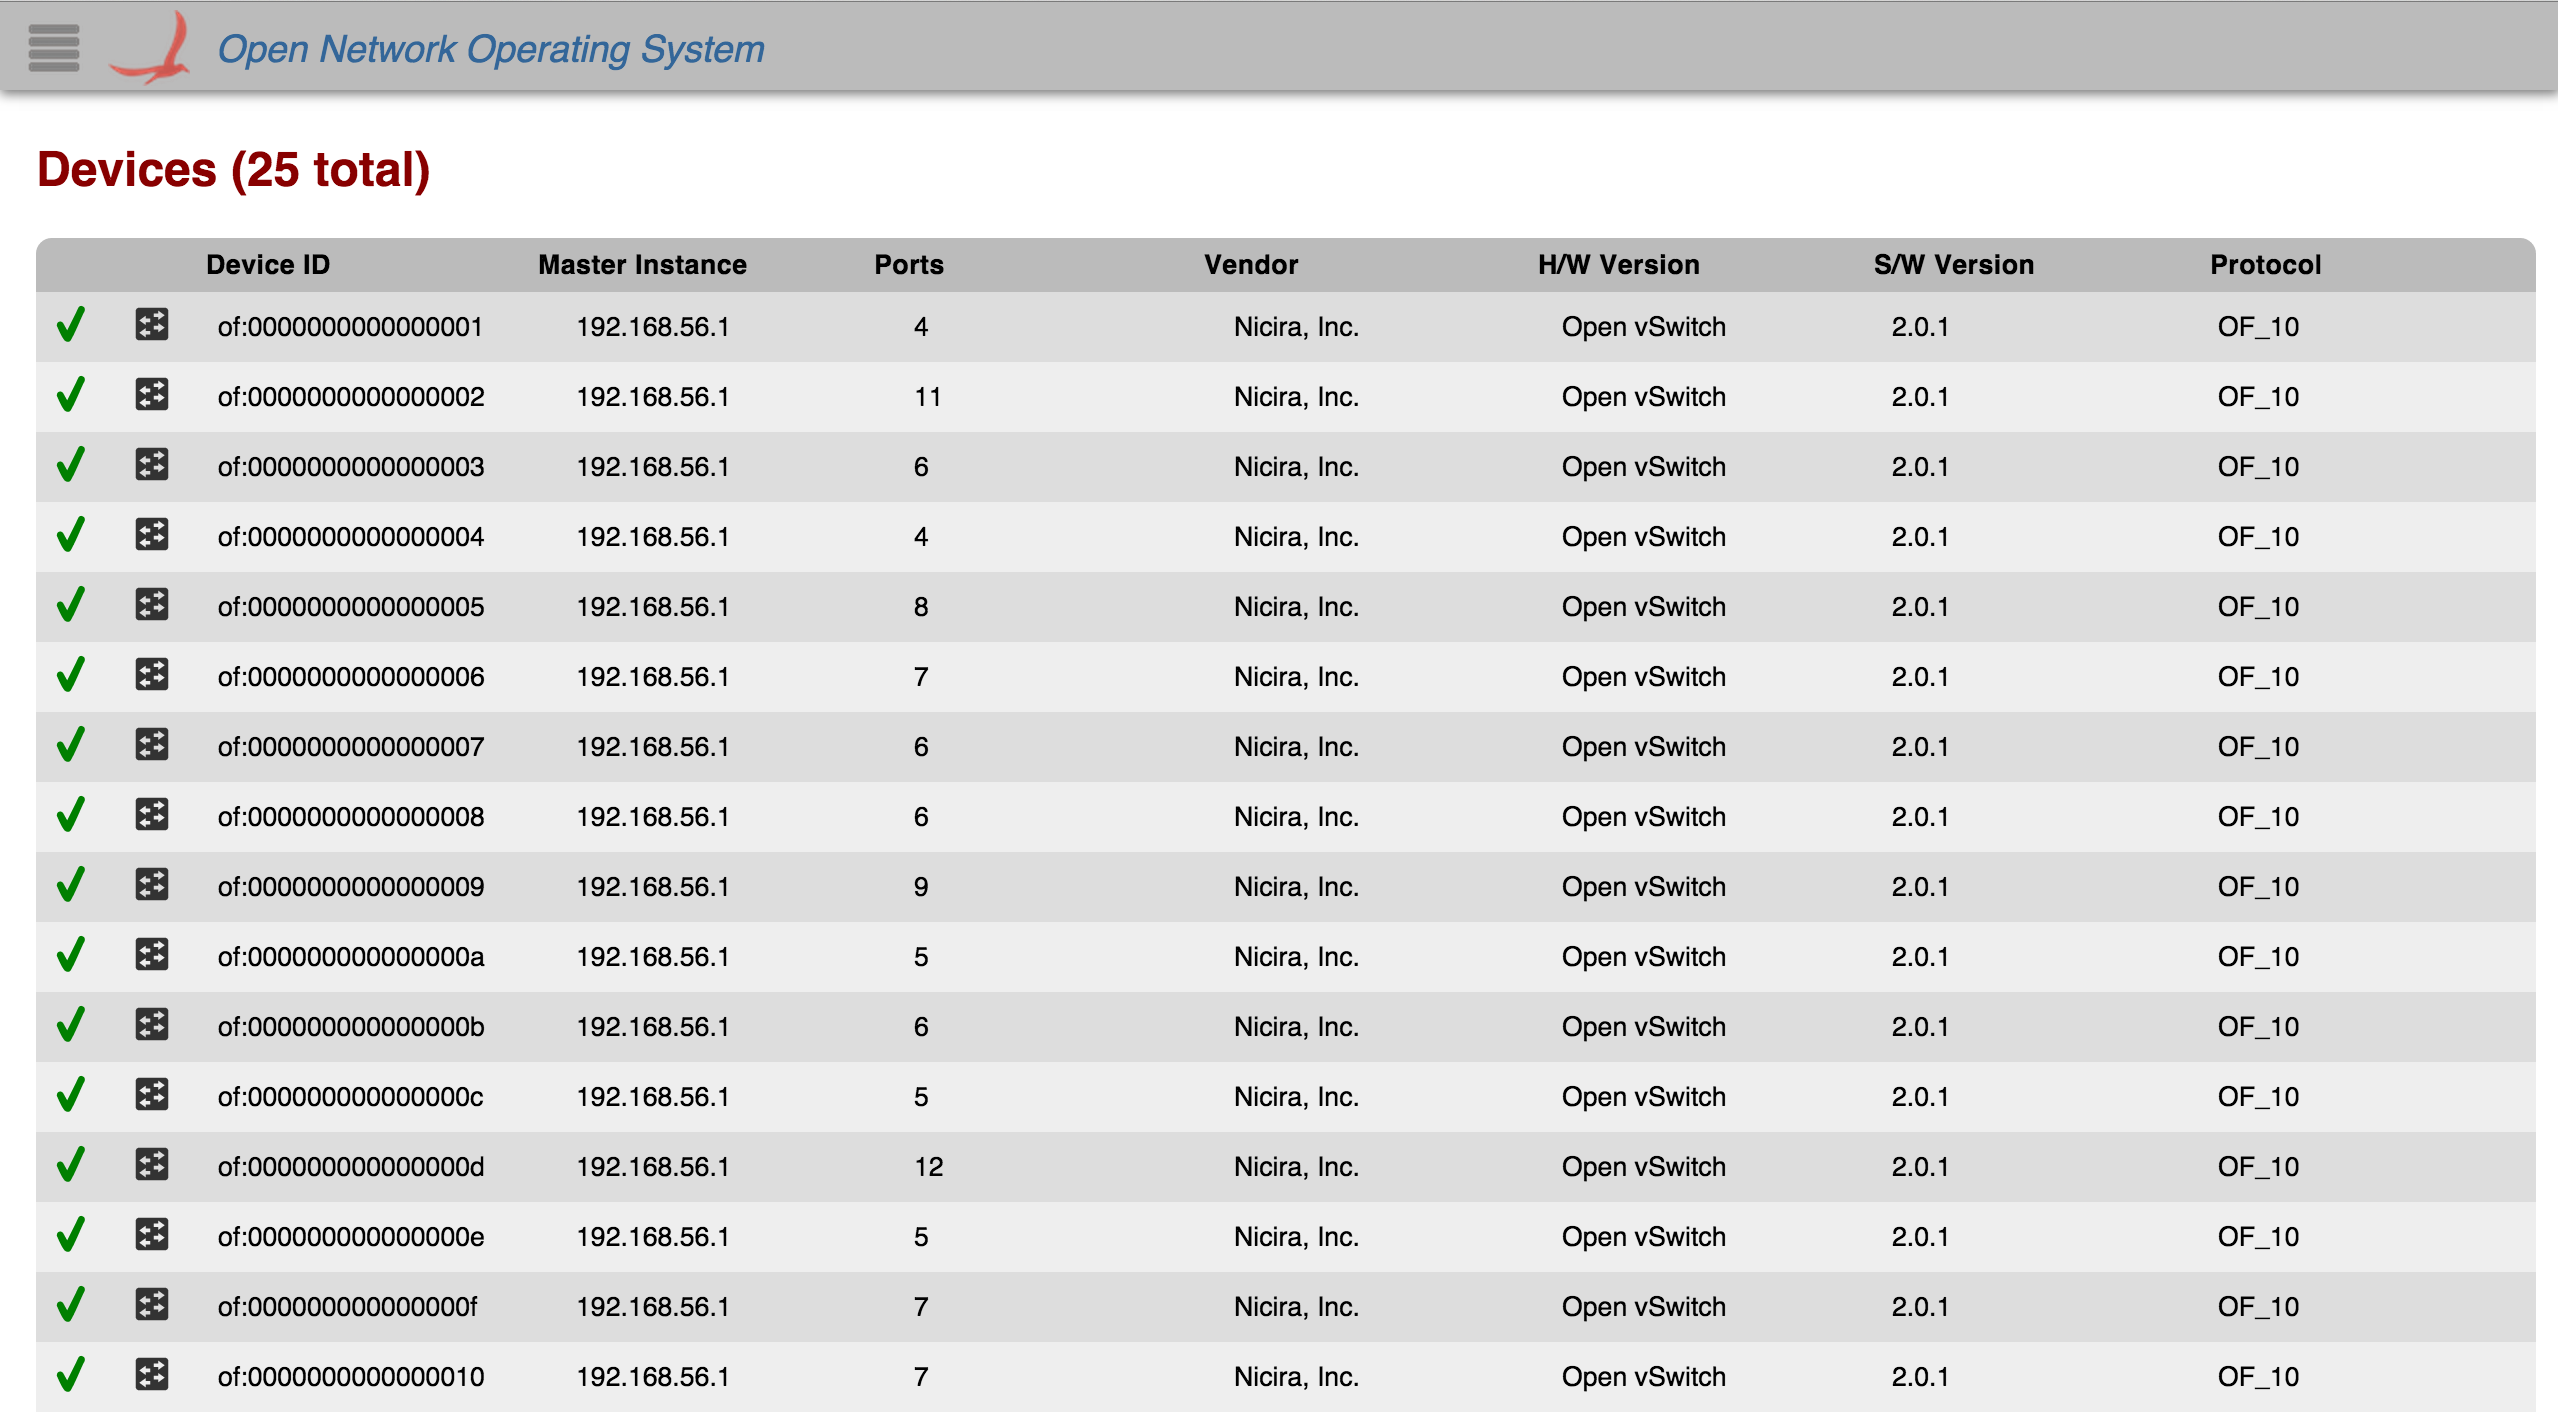
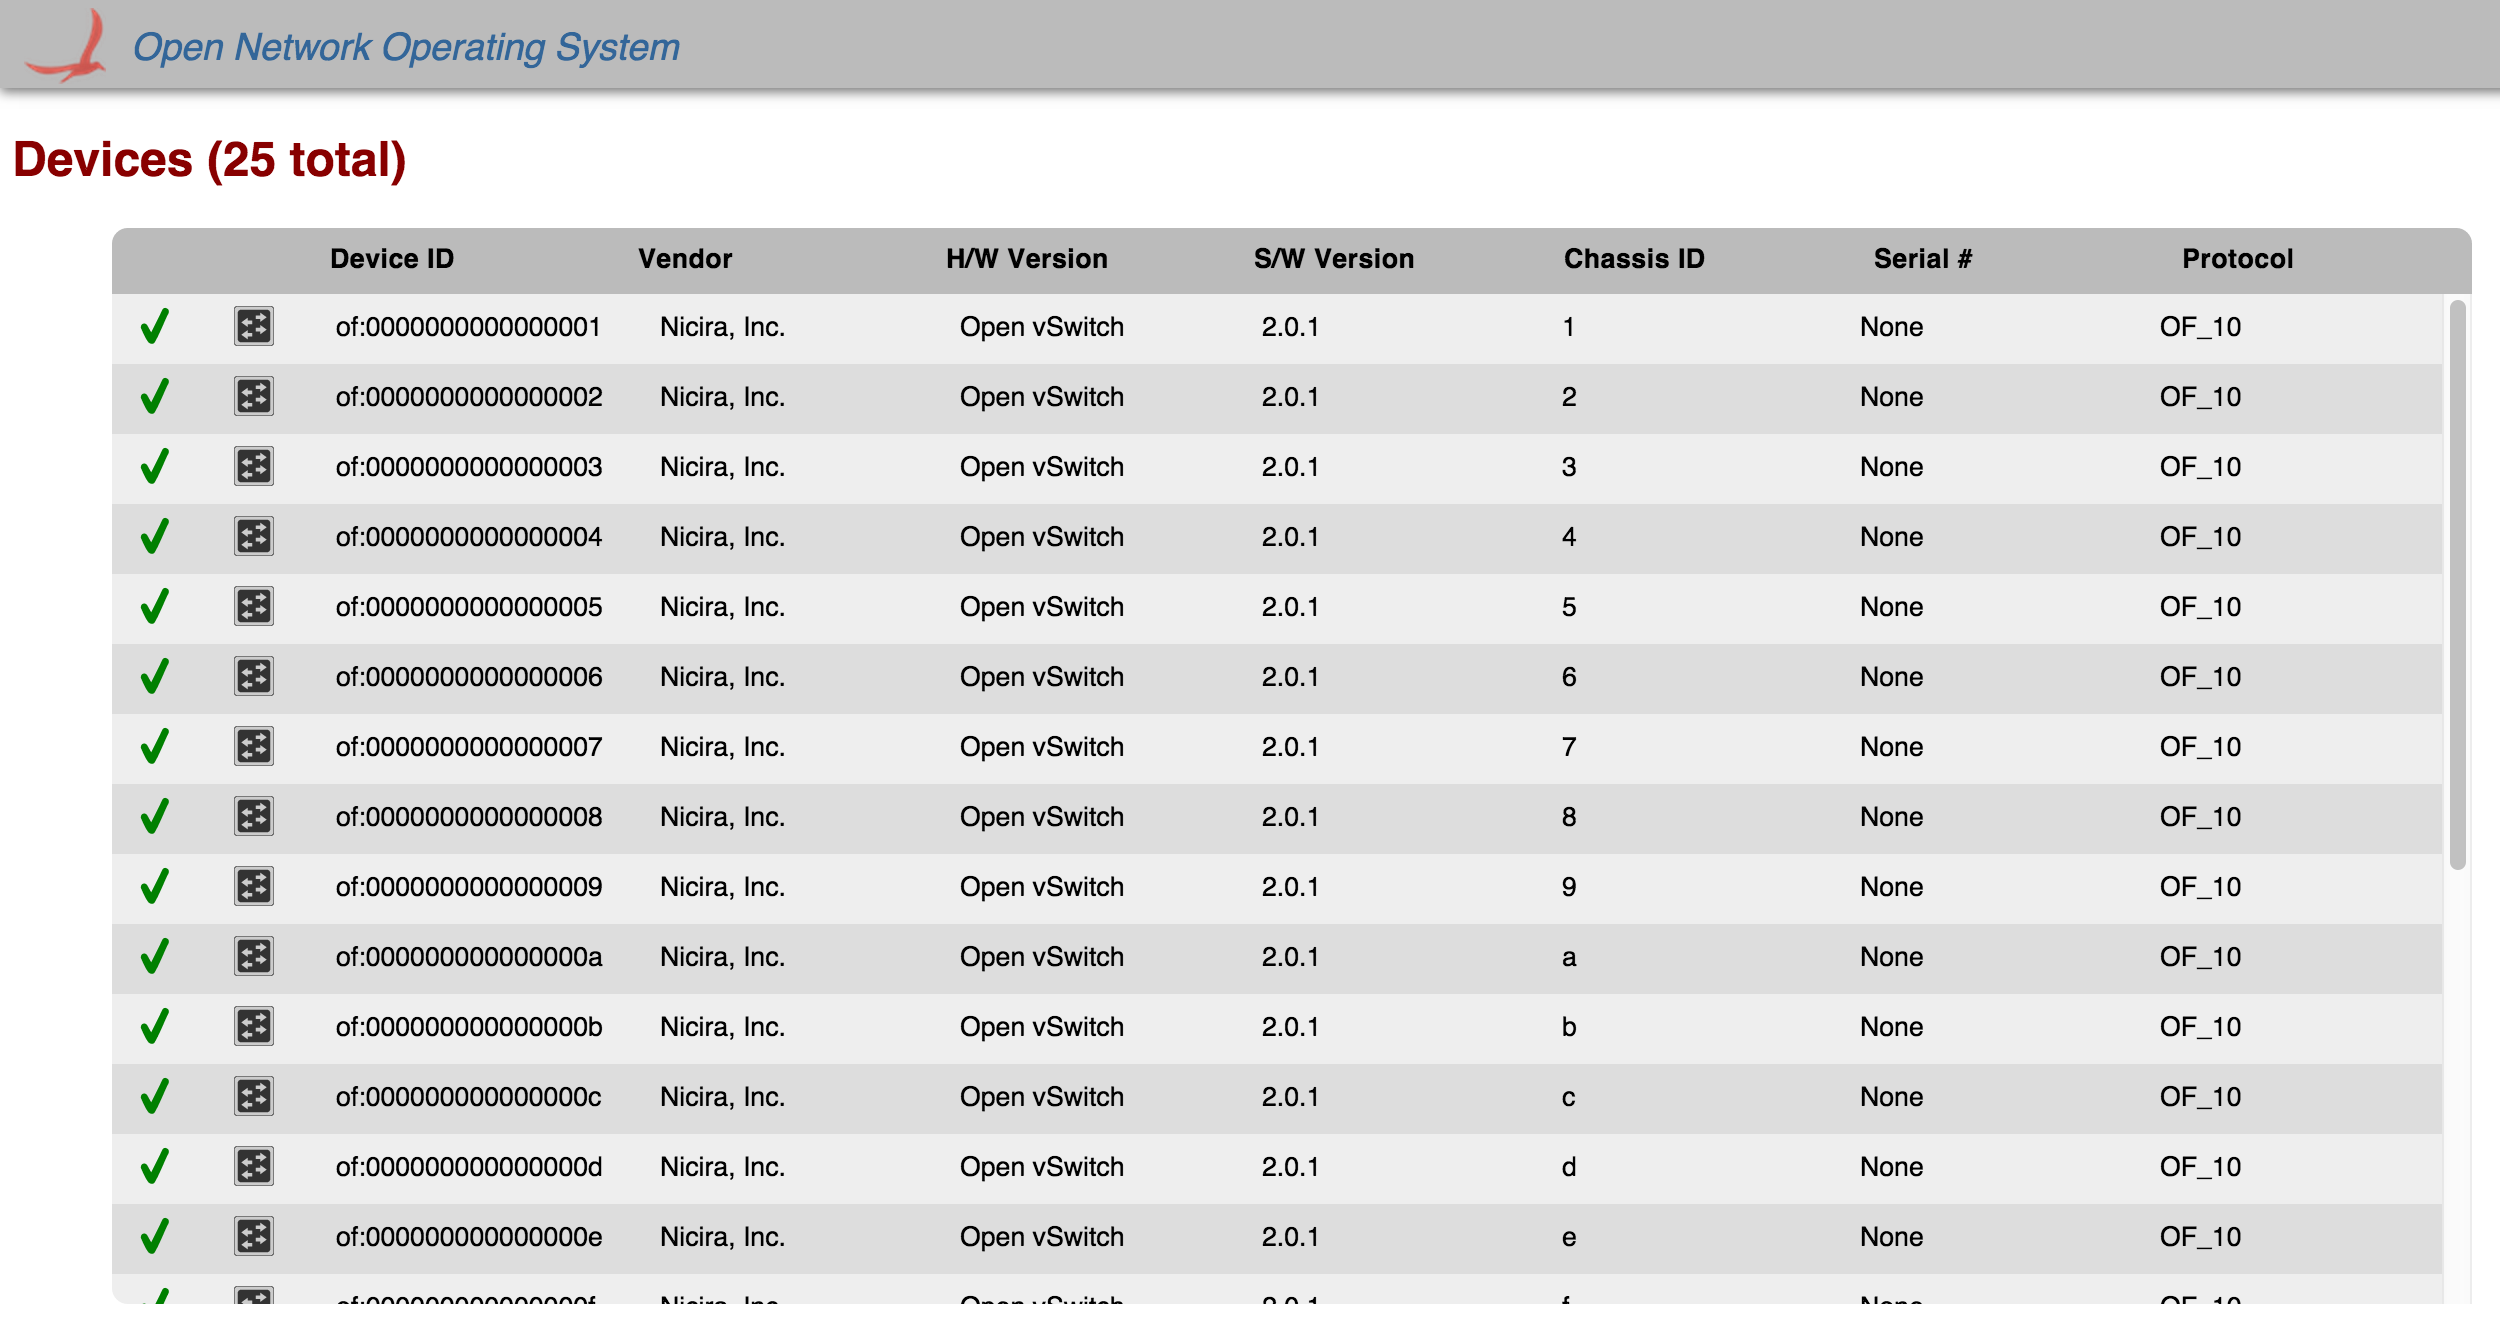
Each row in the table is a single device on the network. To see more devices, scroll down inside the table body.
...
The total number of devices connected (both online and offline) is displayed in the upper left corner.
Table Body
Column Headers
The column headers for each section in the table are sortable (see tabular view page). By default, the devices are sorted in ascending order by Device ID. Once any header is clicked on, table will be sorted in ascending order and an icon will appear indicating the sorting direction.

If the same table header is clicked on again, then the sorting direction will reverse and the table will be sorted in descending order by that header. The icon will change to indicate the new sorting direction.

You You can toggle between ascending and descending on any named header.
Icons
Availability
![]() If the device is online, a green checkmark is displayed in the far left column of the table.
If the device is online, a green checkmark is displayed in the far left column of the table.
![]() If the device is offline, a red "x" will be displayed instead.
If the device is offline, a red "x" will be displayed instead.
Device Type
![]()
![]() Indicates the device is a switch connected to the network.
Indicates the device is a switch connected to the network.
![]() Indicates the device is a roadm.
Indicates the device is a roadm.
Details Panel
All rows in the table are selectable. When a device (table row) is clicked on, a details panel about that device will appear on the right edge of the screen with more detailed information about the device.

You can close the panel by deselecting the table row (clicking on the same device again), or by clicking on the 'X' in the upper right corner of the panel.
Ports Table
The table of ports inside the panel is scrollable if there are too many ports to show all at once. It is not sortable. This table will be expanded on in future releases.