Due to a ransomware attack, the wiki was reverted to a July 2022 version. . We apologize for the lack of a more recent valid backup.
...
The panel can be hidden (and subsequently re-shown) by pressing the 'I' (for "instancesInstances") key.
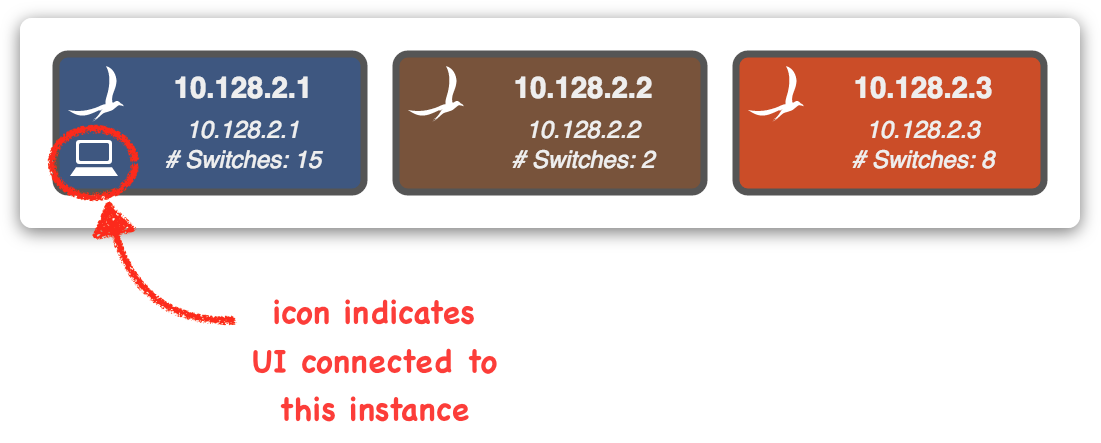
The color coding indicates controller mastership; each device in the topology will be colored corresponding to which instance has mastership over it. For example:
...
Click again on the same instance box (or press Esc) to cancel the affinity highlighting.
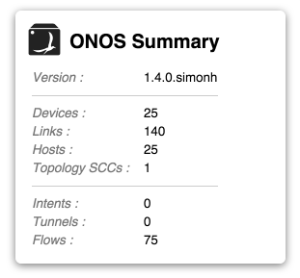
Summary Panel
The summary panel displays key properties of the network.
The panel can be hidden (and subsequently re-shown) by pressing the 'O' (for "ONOS summary") key.
| Warning |
|---|
From here down, still needs to be updated. |
| Icon | Key | Description | Icon | Key | Description | |
|---|---|---|---|---|---|---|
| V | Show all related intents | E | Equalize mastership roles | |||
| Right Arrow | Show next related intent | |||||
| Left Arrow | Show previous related intent | |||||
| W | Monitor traffic of selected intent | |||||
| A | Monitor all traffic | |||||
| F | Show device link flows |
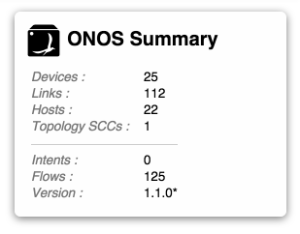
Summary Panel
The summary panel shows a brief summary of properties of the network.
The panel can be hidden (and subsequently re-shown) by pressing the 'O' key.
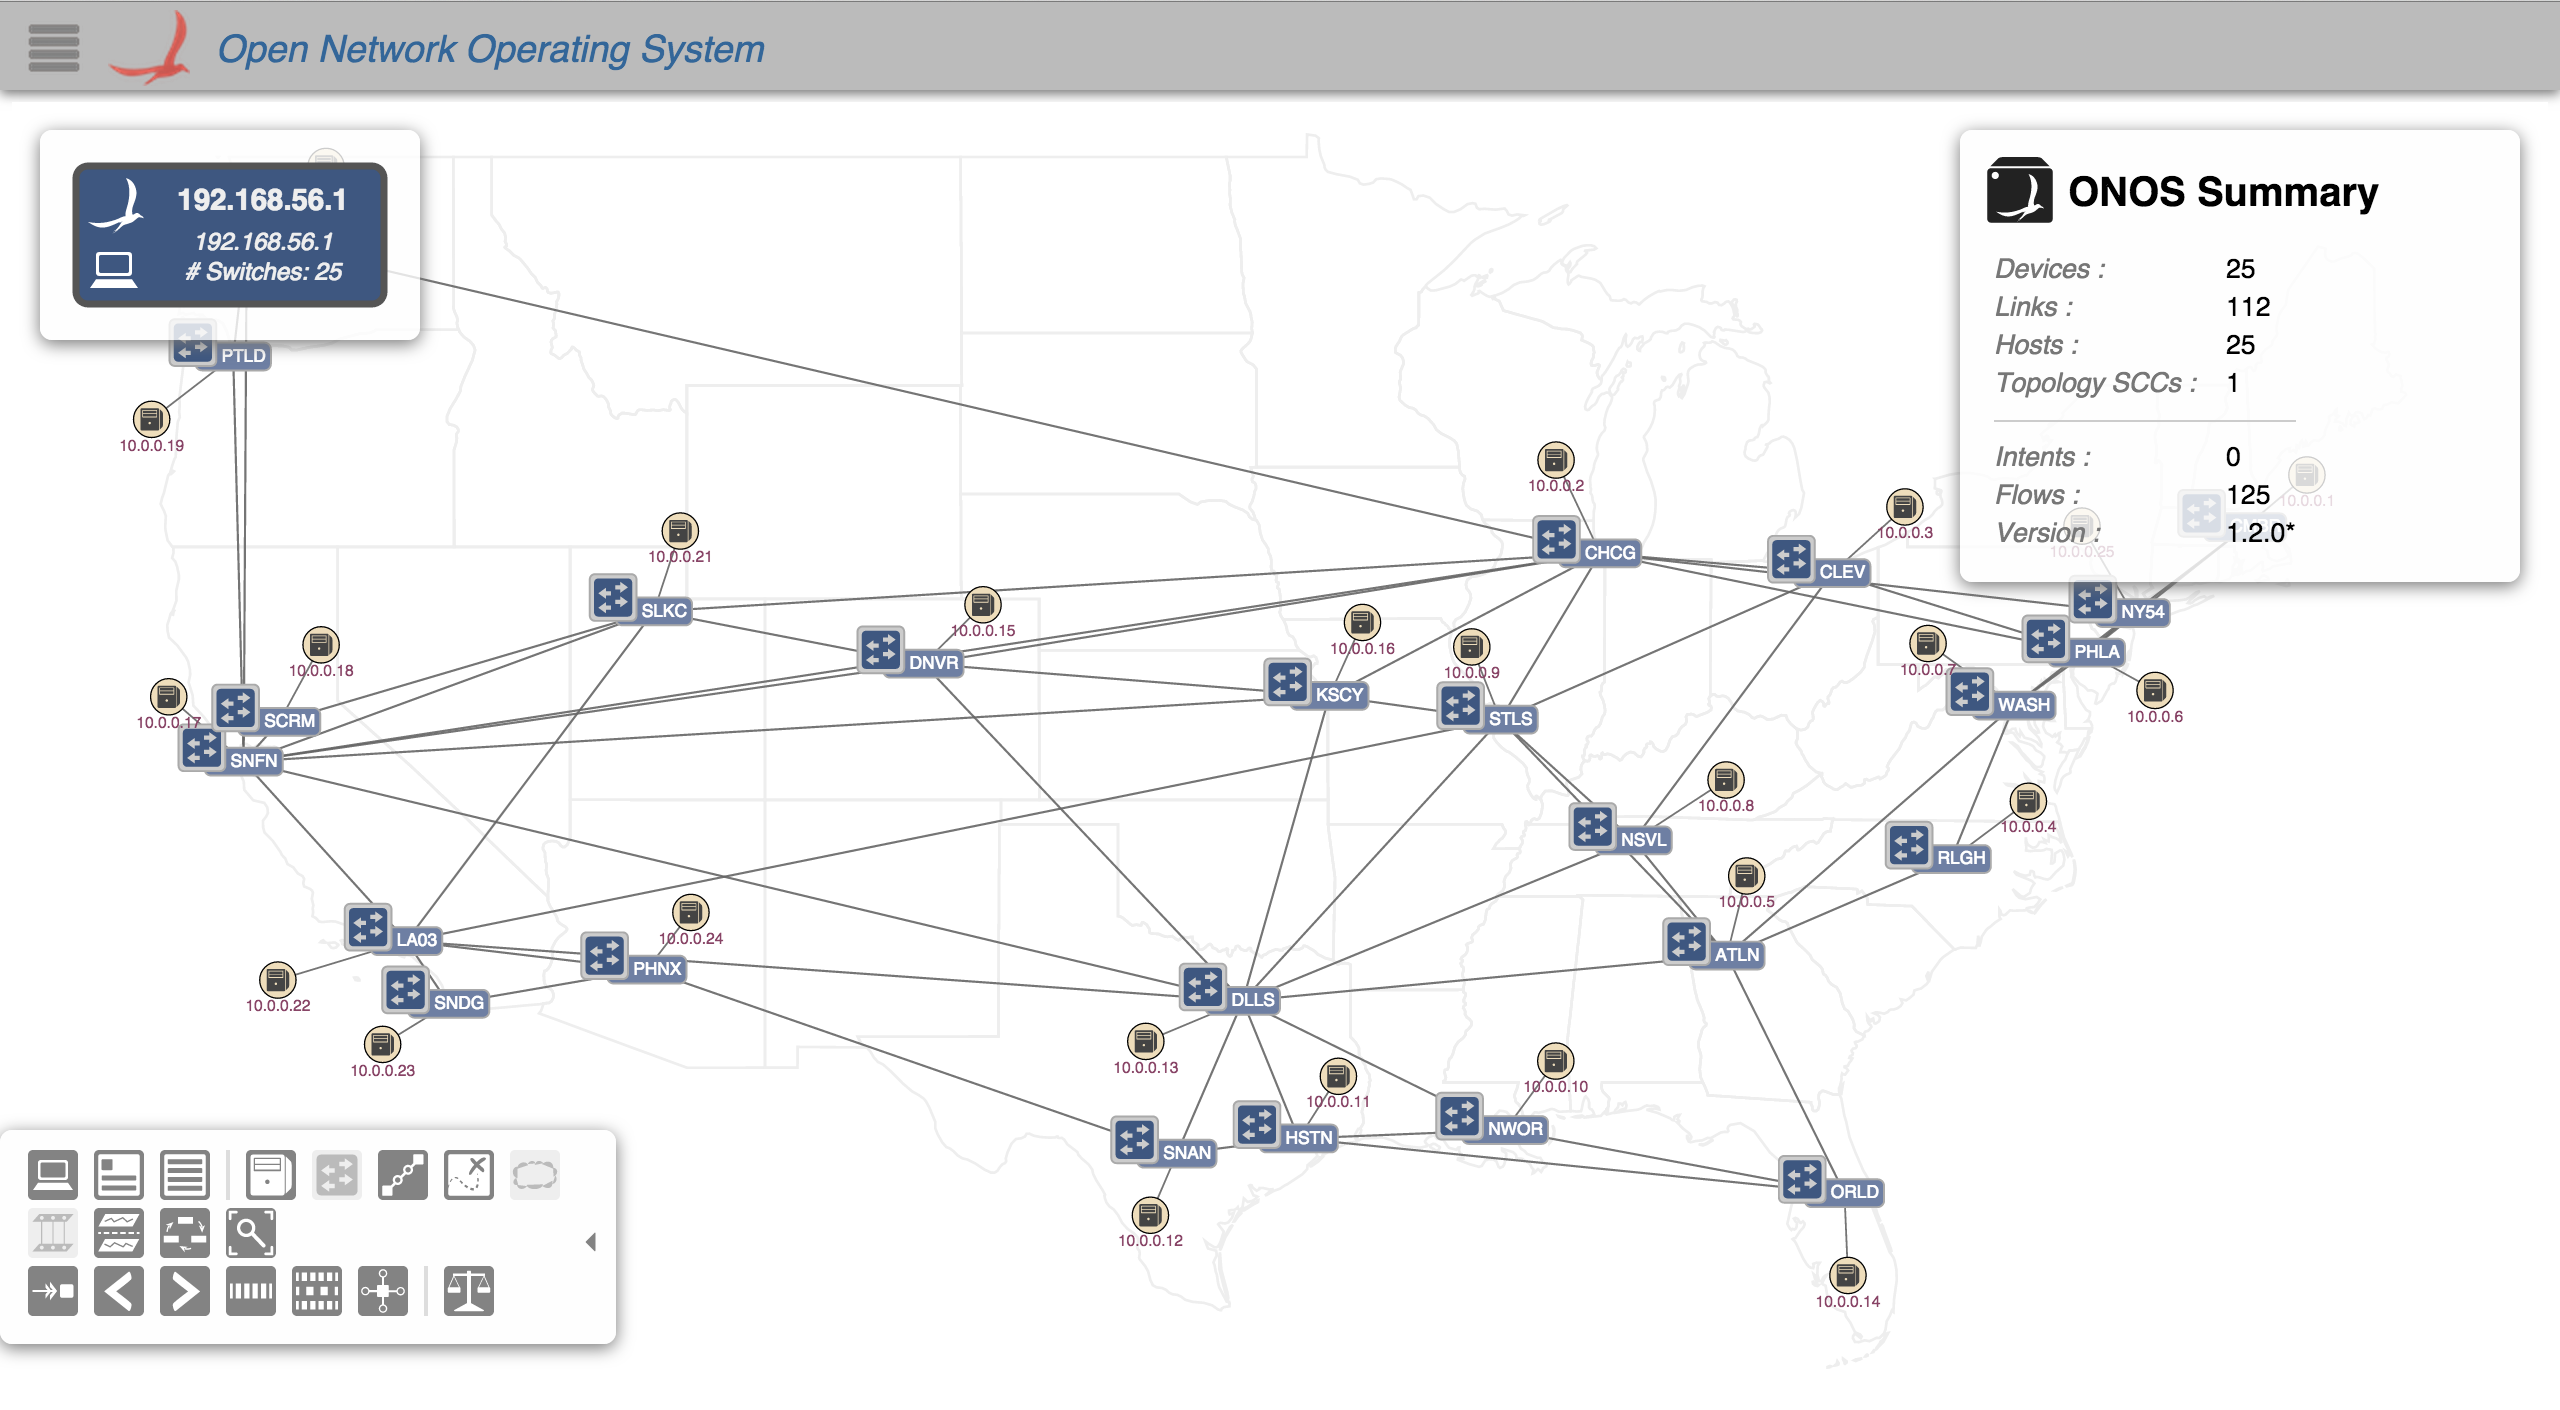
Nodes and Links
Nodes and Links
The network topology The network topology is represented by an undirected graph of nodes and links. The nodes represent devices (switches) and hosts; the links represent, uh, links.
...
Additionally, pressing the 'L' key will cycle through the devices labels ("friendly", "ID" "no-label"):
Mouse Gestures
A node (device/host) may be manually repositioned (and pinned into place) by clicking and dragging it to a new location.
NOTE: To unpin a pinned node, hover the mouse over the node and press the 'U' (Unpin) key.
Clicking on a node will select it (and deselect any other selections). Details of the selected node will appear in the details panel. Note that action buttons relating to the selection are provided at the bottom of the panel.
Multiple selections may be achieved by holding down the Shift key while clicking on a node - this toggles the selection state of that node.
Pressing the Escape key will clear the current selection.
Panning and zooming the topology is achieved with Cmd-drag (or Alt-drag) and Cmd-scroll (or Alt-scroll) gestures. Pressing the 'R' key will reset pan/zoom to the default values.
Details Panel
The details panel appears when something of interest is "selected".
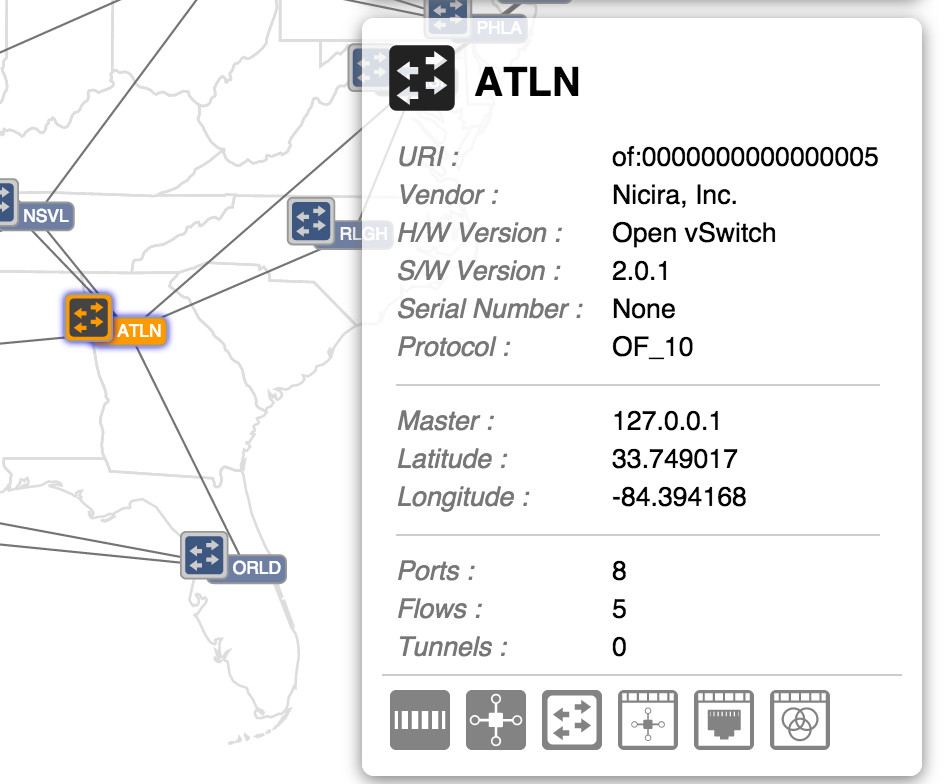
When a single device is selected, properties of that device are displayed, along with action buttons:
...
Gestures
A node (device/host) may be manually repositioned (and pinned into place) by clicking and dragging it to a new location.
NOTE: To unpin a pinned node, hover the mouse over the node and press the 'U' (Unpin) key.
Clicking on a node will select it (and deselect any other selections). Details of the selected node will appear in the details panel. Note that action buttons relating to the selection are provided at the bottom of the panel.
Multiple selections may be achieved by holding down the Shift key while clicking on a node - this toggles the selection state of that node.
Pressing the Escape key will clear the current selection.
Panning and zooming the topology is achieved with Cmd-drag (or Alt-drag) and Cmd-scroll (or Alt-scroll) gestures. Pressing the 'R' key will reset pan/zoom to the default values.
Details Panel
The details panel appears when something of interest is "selected".
When a single device is selected, properties of that device are displayed, along with action buttons:
| Topology View Actions | Navigation Actions | ||
|---|---|---|---|
| Show Related Traffic | Show Device View for Selected Device | ||
| Show Device Flows | Show Flow View for Selected Device | ||
| Show Port View for Selected Device | |||
| Show Group View for Selected Device | |||
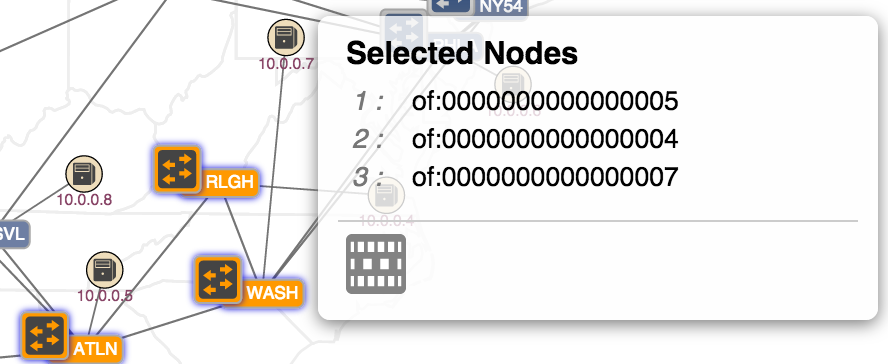
When multiple devices are selected, the details panel switches format to show the IDs of the selections and provides a single action button:
![]() Show Related Traffic
Show Related Traffic
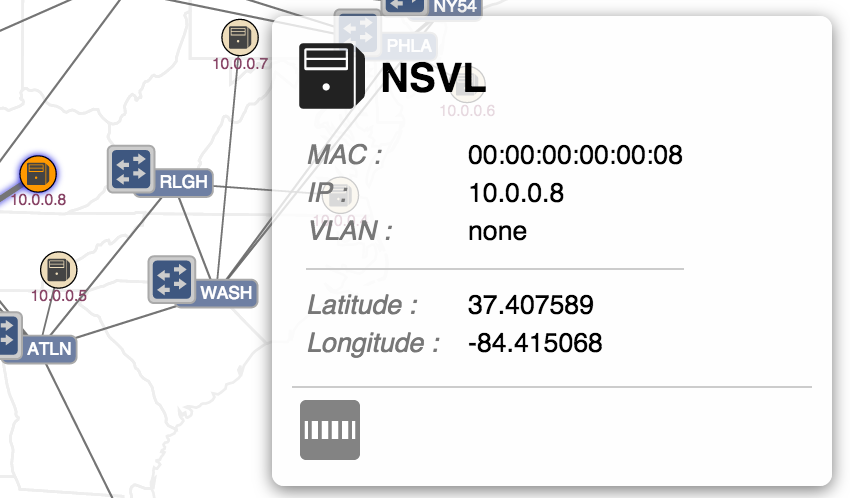
When a single host is selected, properties of that host are displayed, along with an action button:
![]() Show Related Traffic
Show Related Traffic
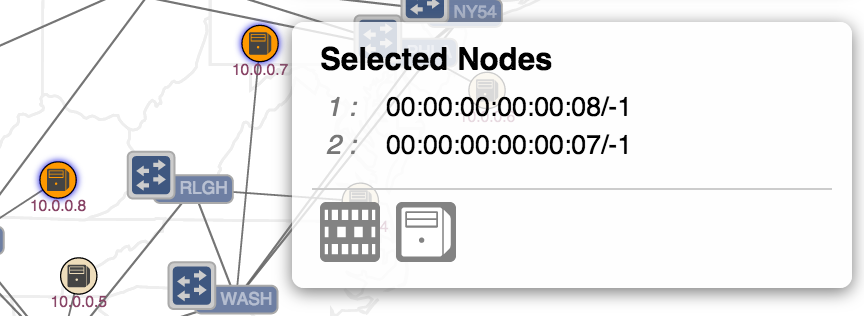
When exactly two hosts are selected, their IDs are shown, along with the following action buttons:
![]() Show Related Traffic
Show Related Traffic
![]() Create Host-to-Host Flow
Create Host-to-Host Flow
Traffic Overlay functions
| Icon | Key | Description |
|---|---|---|
| V | Show all related intents | |
| Right Arrow | Show next related intent | |
| Left Arrow | Show previous related intent | |
| W | Monitor traffic of selected intent | |
| A | Monitor all traffic | |
| F | Show device link flows |
...
When multiple devices are selected, the details panel switches format to show the IDs of the selections and provides a single action button:
![]() Show Related Traffic
Show Related Traffic
When a single host is selected, properties of that host are displayed, along with an action button:
![]() Show Related Traffic
Show Related Traffic
When exactly two hosts are selected, their IDs are shown, along with the following action buttons:
![]() Show Related Traffic
Show Related Traffic
![]() Create Host-to-Host Flow
Create Host-to-Host Flow
...
Visualizing Traffic
A number of commands allow different visualizations of traffic on the network.
...