Due to a ransomware attack, the wiki was reverted to a July 2022 version. . We apologize for the lack of a more recent valid backup.
(Work in progress...)
Overview
The Topology View provides a visual (cluster-wide) overview of the network topology controlled by ONOS. When the topology view is instantiated it establishes a websocket connection with the server (ONOS instance to which it is connected) and exchanges "event" messages to determine the topology state. The view is thus event-driven, with events such as addDevice, addLink, addHost, updateDevice, etc.
Instance Panel
The instance panel shows summary information about the ONOS instances in the cluster. There will be one box per instance, showing the instance ID, IP address, and number of switches for which the instance is master.
The panel can be hidden (and subsequently re-shown) by pressing the 'I' key.
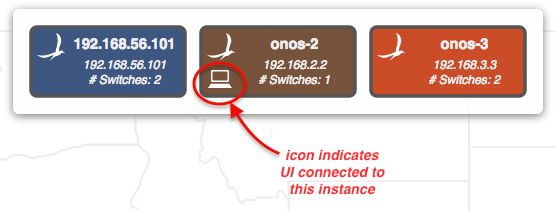
The color coding shows controller mastership; each device in the topology will be colored to match the controller that currently has mastership over that device. For example:
As a clearer indication of mastership, clicking on an instance in the instance panel will highlight the mastership affinity with devices in the topology. For example:
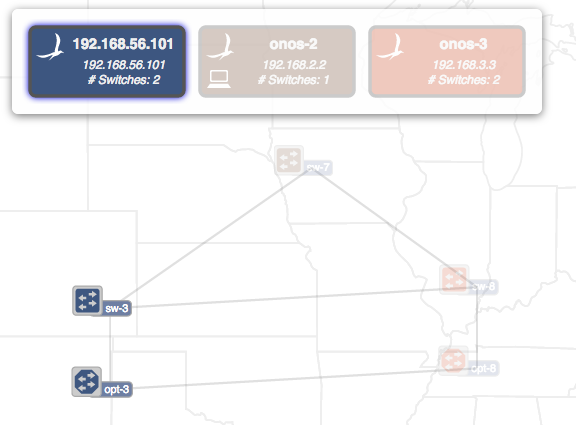
Click again (or press the Escape key) to cancel the affinity indication.
Summary Panel
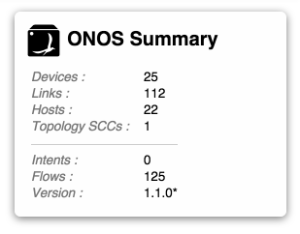
The summary panel shows a brief summary of properties of the network.
The panel can be hidden (and subsequently re-shown) by pressing the 'O' key.
Nodes and Links
The network topology is represented by an undirected graph of nodes and links. The nodes represent devices (switches) and hosts; the links represent, uh, links.
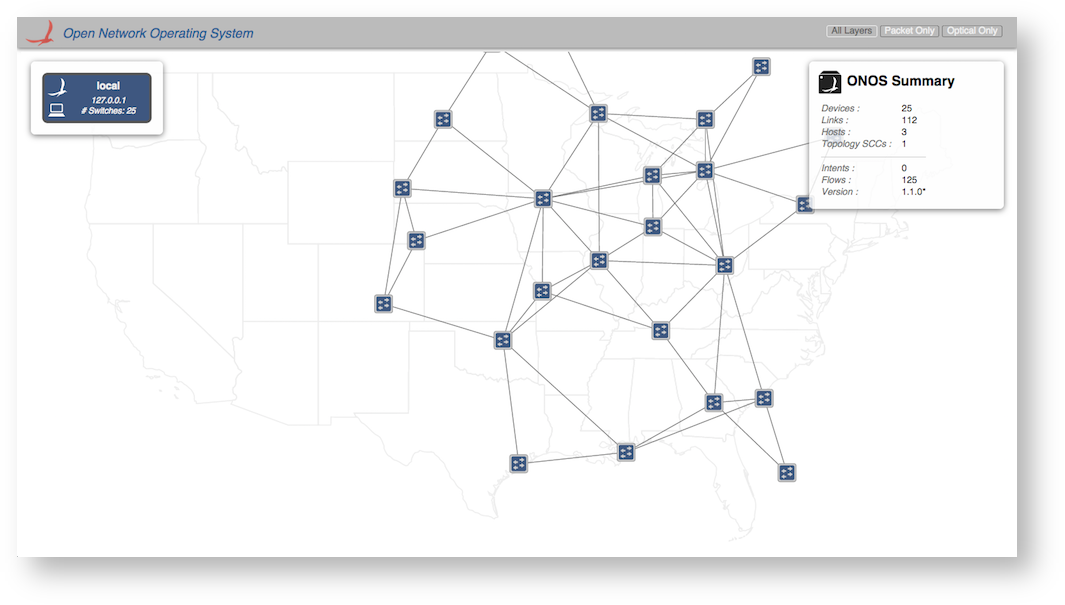
The D3 Force Layout algorithm is used to provide a reasonable initial layout of the nodes and links in the absence of any other spatial information. As an example, the following image shows a (free-floating) network of 25 nodes:
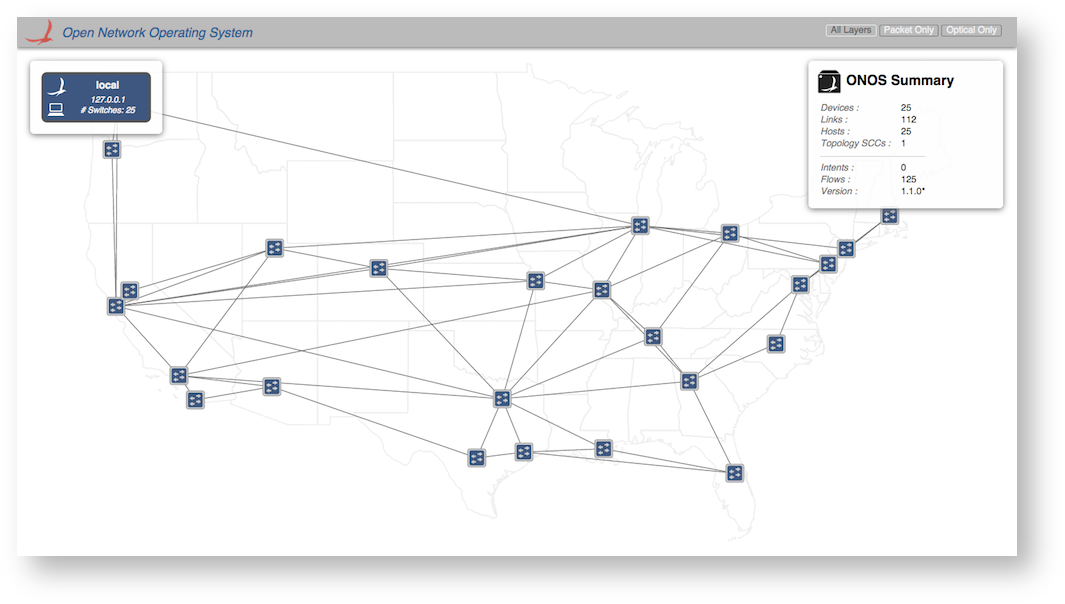
The onos-topo-cfg command (script) can be used to upload topology meta-data to the server. This may include longitude/latitude information for each of the nodes.
cd ~/onos-next/tools/test/toposonos-topo-cfg localhost attmpls.json
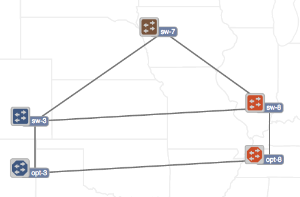
On receipt of the data, the server sends node updates to the GUI. On the GUI side, the longitude/latitude data is used to calibrate node positions with the background map:
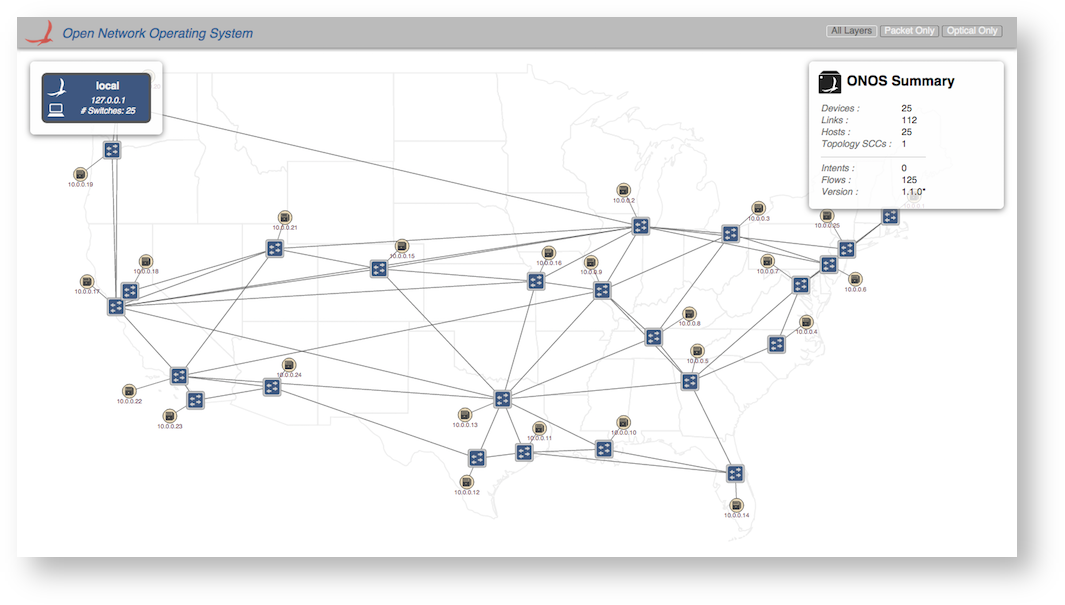
Note that, by default, hosts are hidden. Pressing the 'H' key will toggle the host visibility:
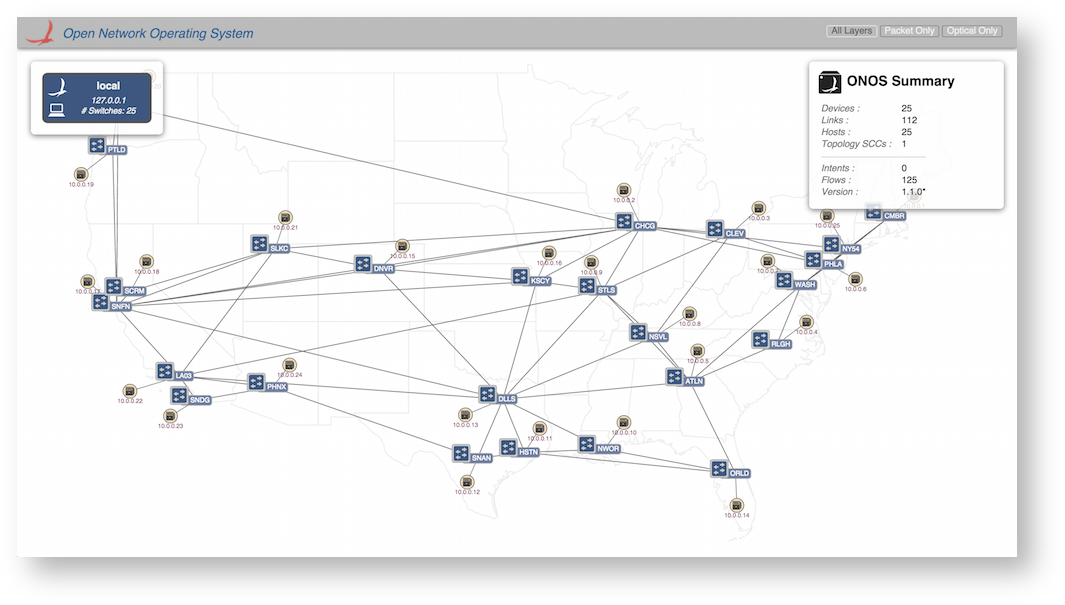
Additionally, pressing the 'L' key will cycle through the devices labels ("friendly", "ID" "no-label"):
Quick Help
By this point you have probably realized that there are a number of "keystroke commands" that can be applied to the topology view. These commands are summarized in a Quick Help panel which can be displayed by pressing the slash '/' or backslash '\' key. Pressing either of these keys again (or pressing the Escape key) will dismiss the panel.
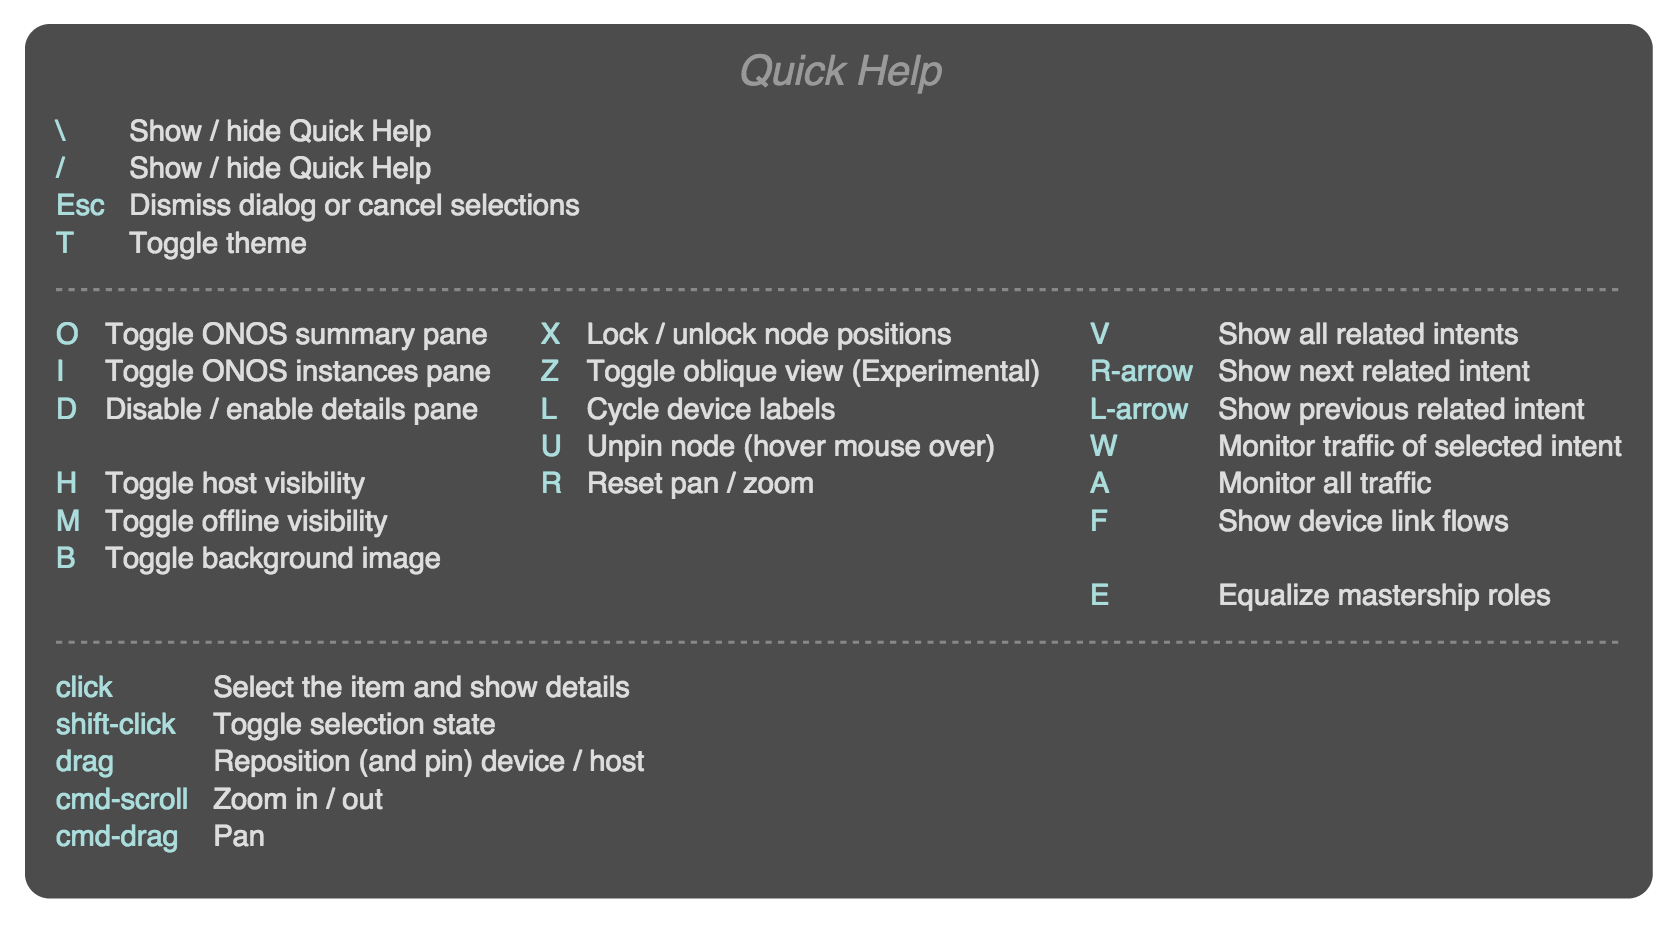
The available commands listed in this panel are described in the other sections of this page.
Mouse Gestures
A node (device/host) may be manually repositioned (and pinned into place) by clicking on it and dragging it.
NOTE: To unpin a pinned node, hover the mouse over the node and press the 'U' (Unpin) key.
Clicking a node will select it (and deselect any other selections). Details of the selected node will appear in the Details Panel.
The view may be panned with Cmd-drag (or Alt-drag), and zoomed with Cmd-scroll (or Alt-scroll).
Miscellaneous Controls
- Cycle labels, etc.
- Equalize mastership roles
- Reset pan/zoom
- etc.
Installing an intent between Hosts
Selecting two hosts and pressing the 'Create Host-to-Host Flow' action button on the details panel.
Visualizing Traffic
Related intents
- Related intents (next/prev)
- Monitor traffic of selected intent
- Monitor all traffic
- Show device link flows