Due to a ransomware attack, the wiki was reverted to a July 2022 version. . We apologize for the lack of a more recent valid backup.
Overview
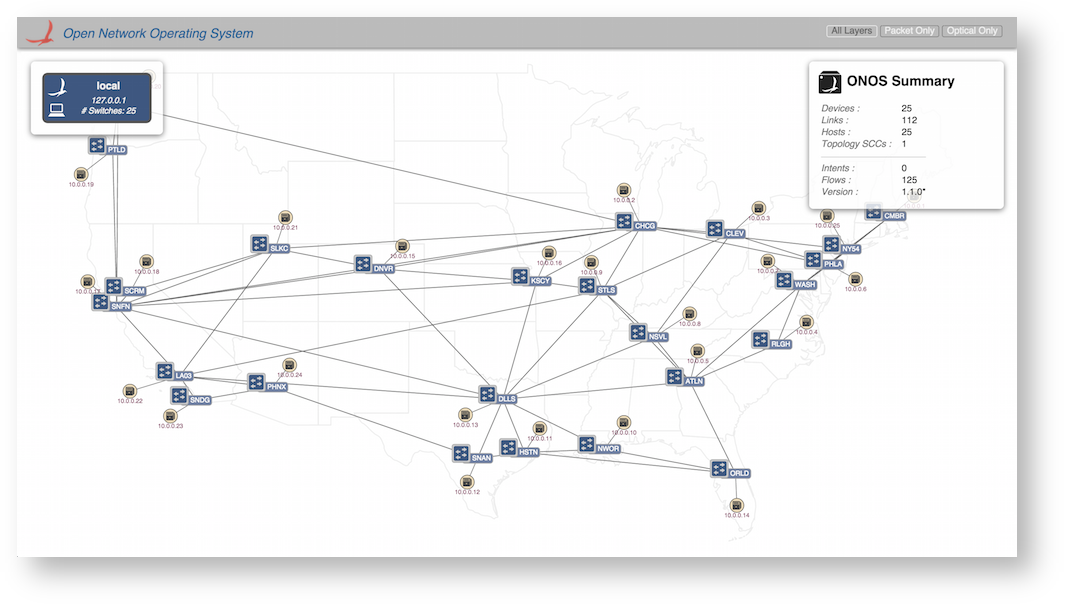
The Topology View provides a visual (cluster-wide) overview of the network topology controlled by ONOS. When the topology view is instantiated it establishes a websocket connection with the server (ONOS instance to which it is connected) and exchanges "event" messages to determine the topology state. The view is thus event-driven, with events such as addDevice, addLink, addHost, updateDevice, etc.
Quick Help
One of the first things to note is that by pressing the slash '/' or backslash '\' key, you can bring up the Quick Help panel. This gives an outline of the keystroke commands and mouse gestures available to you in the Topology View. Pressing either of these keys again (or pressing the Escape key) will dismiss the panel.
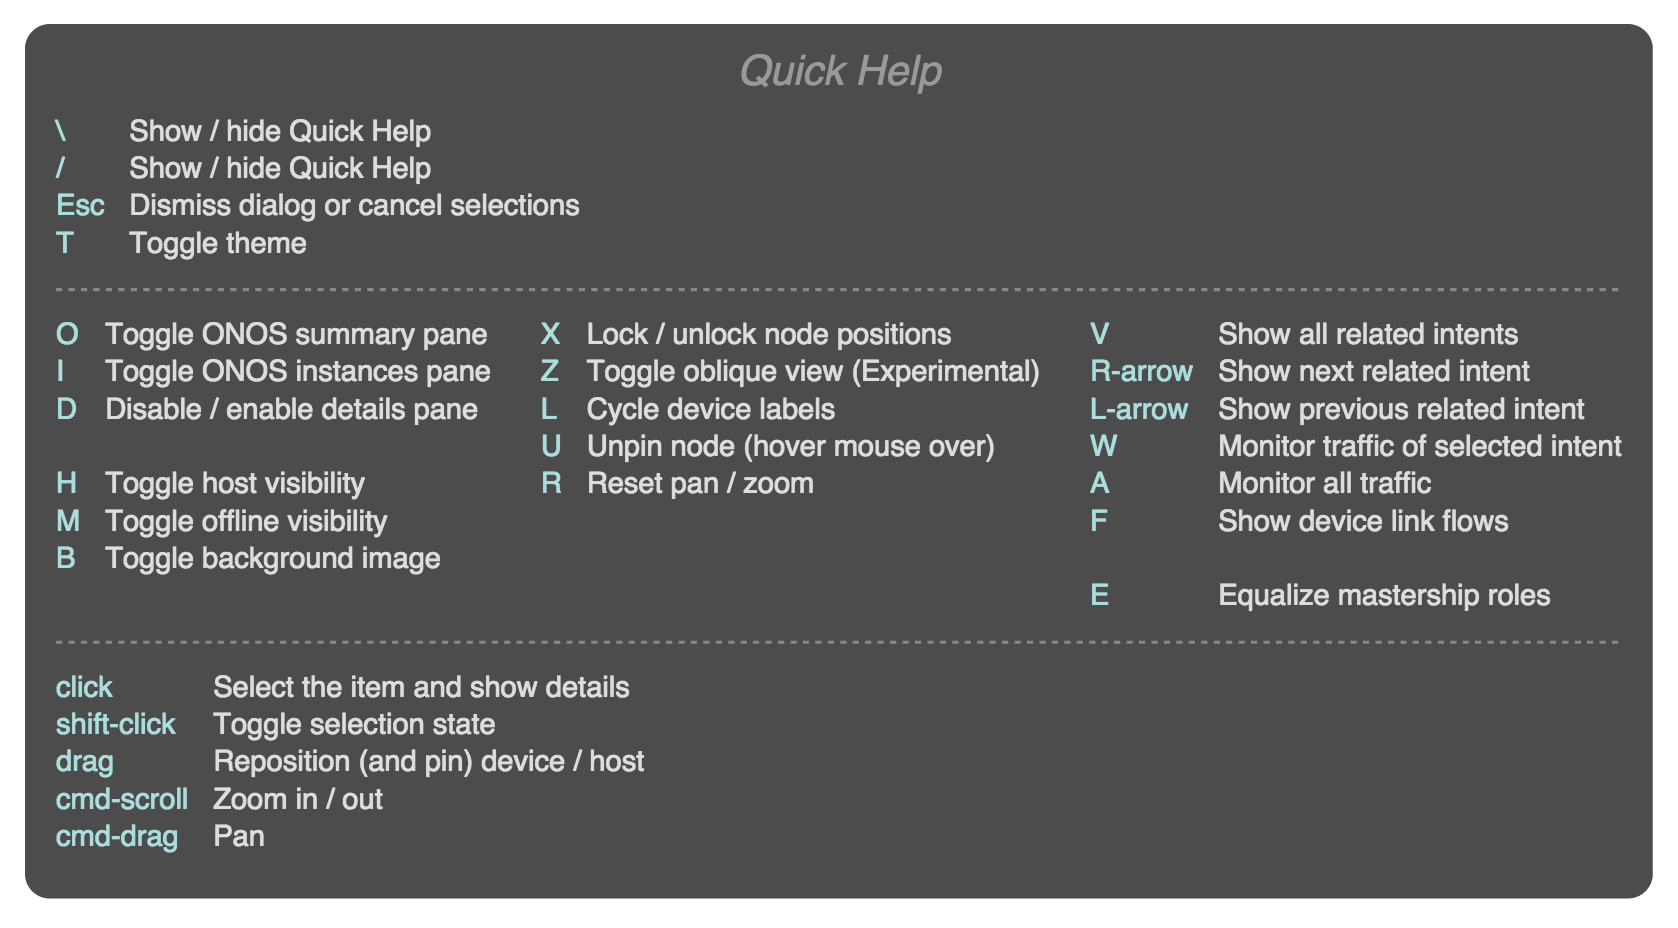
The available commands listed in this panel are described in the sections below.
Instance Panel
The instance panel shows summary information about the ONOS instances in the cluster. There will be one box per instance, showing the instance ID, IP address, and number of switches for which the instance is master.
The panel can be hidden (and subsequently re-shown) by pressing the 'I' key.
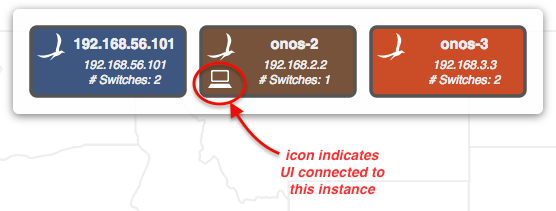
The color coding shows controller mastership; each device in the topology will be colored to match the controller that currently has mastership over that device. For example:
As a clearer indication of mastership, clicking on an instance in the instance panel will highlight the mastership affinity with devices in the topology. For example:
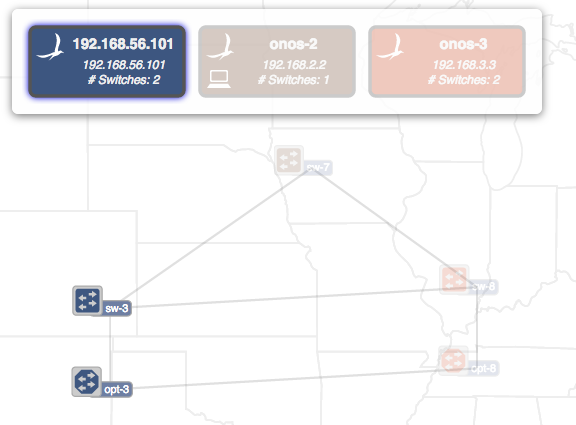
Click again (or press the Escape key) to cancel the affinity indication.
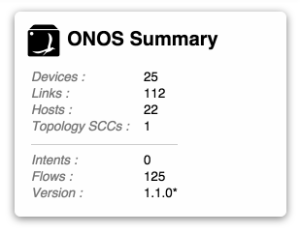
Summary Panel
The summary panel shows a brief summary of properties of the network.
The panel can be hidden (and subsequently re-shown) by pressing the 'O' key.
Nodes and Links
The network topology is represented by an undirected graph of nodes and links. The nodes represent devices (switches) and hosts; the links represent, uh, links.
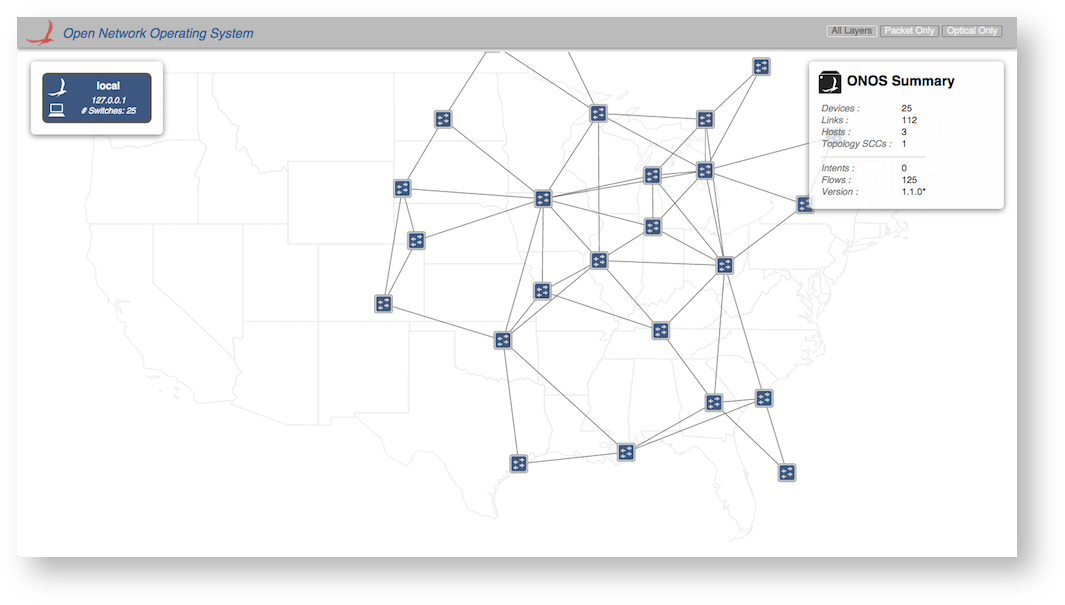
The D3 Force Layout algorithm is used to provide a reasonable initial layout of the nodes and links in the absence of any other spatial information. As an example, the following image shows a (free-floating) network of 25 nodes:
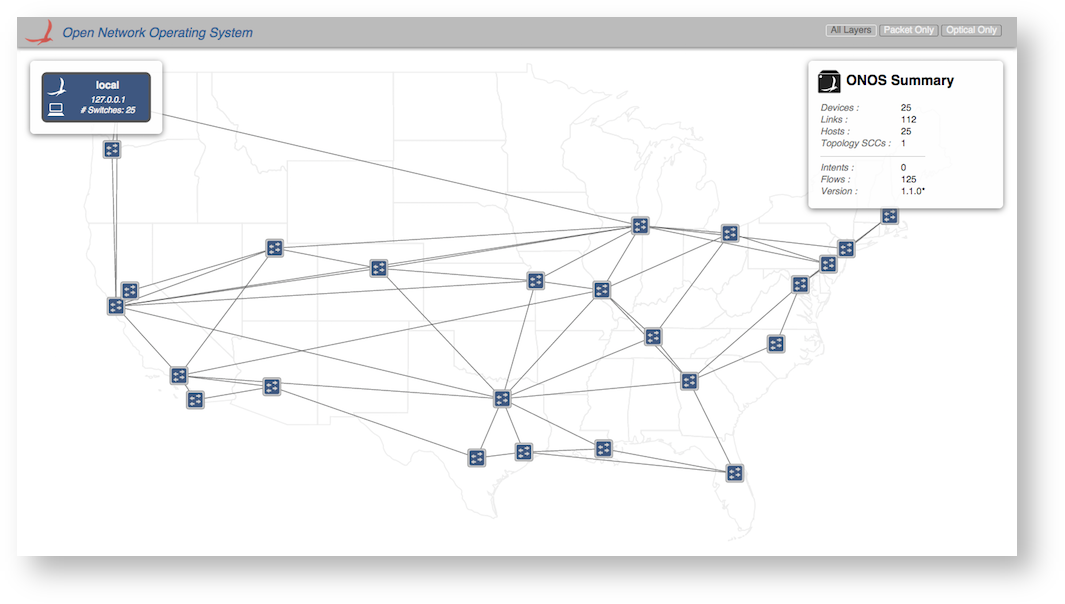
The onos-topo-cfg command (script) can be used to upload topology meta-data to the server. This may include longitude/latitude information for each of the nodes.
cd ~/onos-next/tools/test/toposonos-topo-cfg localhost attmpls.json
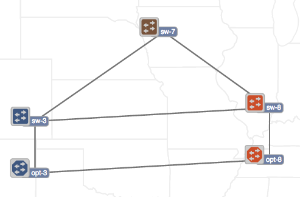
On receipt of the data, the server sends node updates to the GUI. On the GUI side, the longitude/latitude data is used to calibrate node positions with the background map:
Note that, by default, hosts are hidden. Pressing the 'H' key will toggle the host visibility:
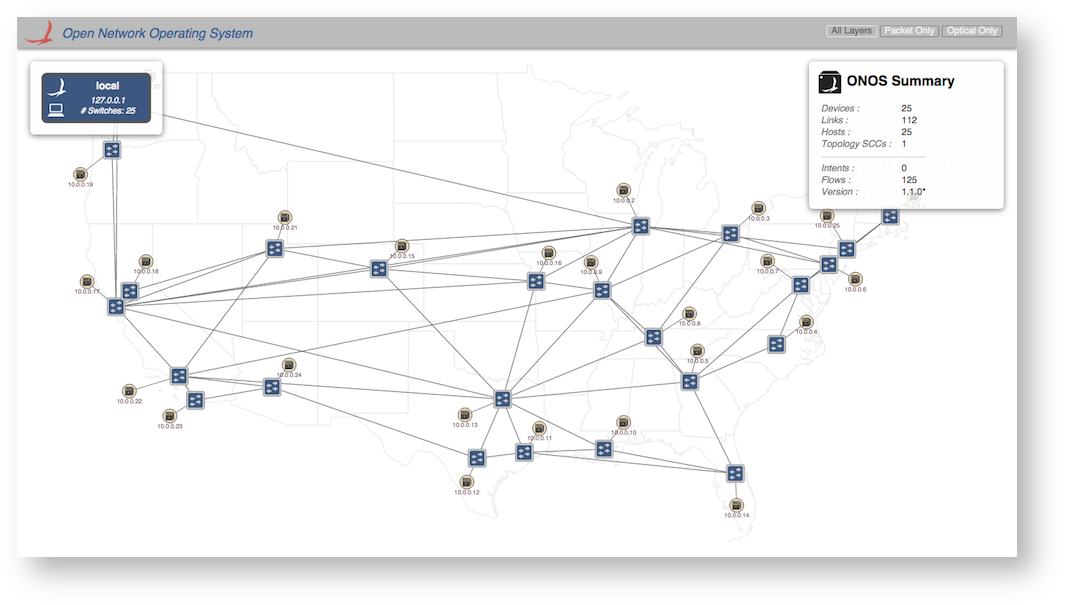
Additionally, pressing the 'L' key will cycle through the devices labels ("friendly", "ID" "no-label"):
Mouse Gestures
A node (device/host) may be manually repositioned (and pinned into place) by clicking and dragging it to a new location.
NOTE: To unpin a pinned node, hover the mouse over the node and press the 'U' (Unpin) key.
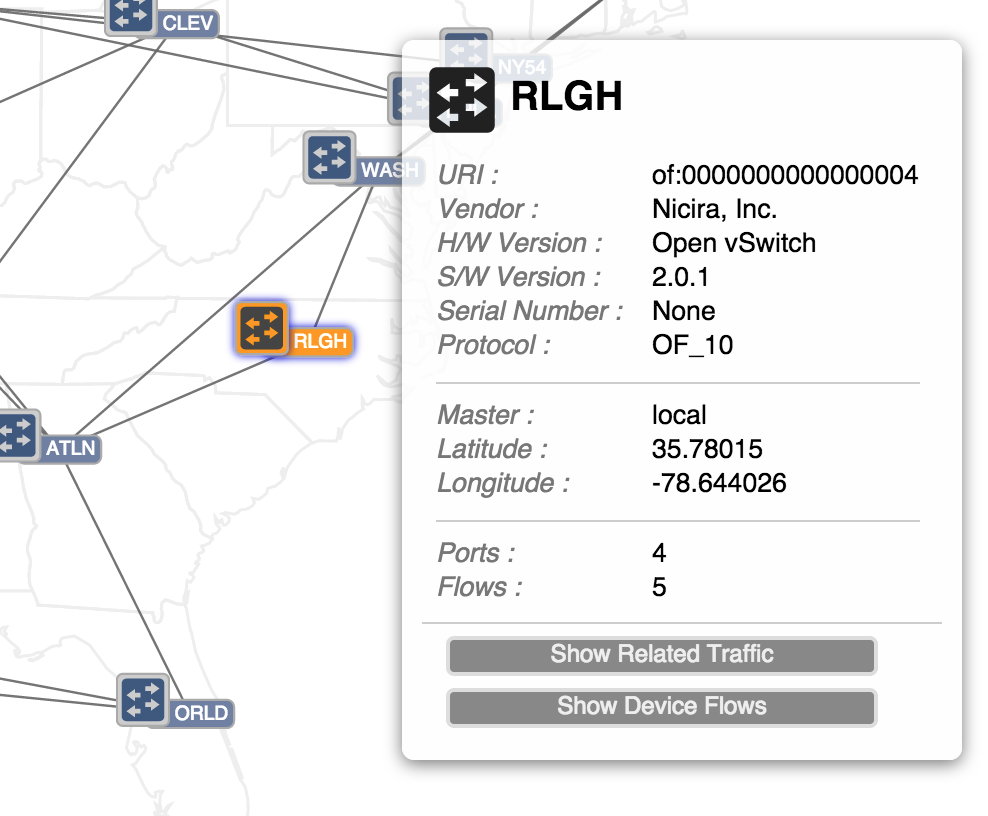
Clicking on a node will select it (and deselect any other selections). Details of the selected node will appear in the details panel. Note that action buttons relating to the selection are provided at the bottom of the panel.
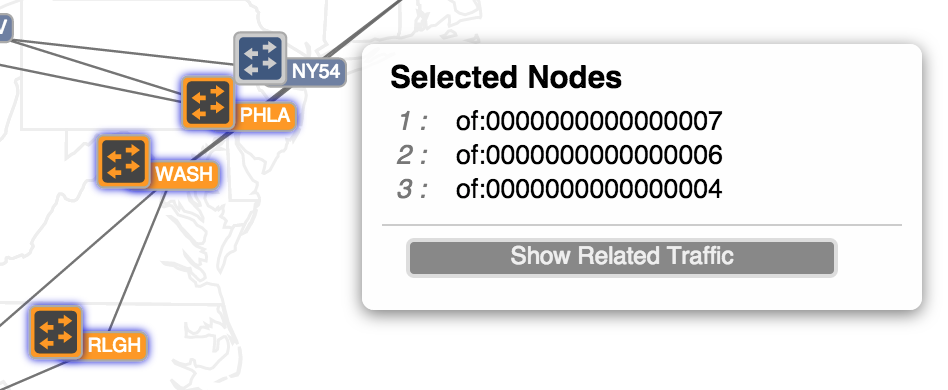
Multiple selections may be achieved by holding down the Shift key while clicking on a node - this toggles the selection state of that node.
Pressing the Escape key will clear the current selection.
Panning and zooming the topology is achieved with Cmd-drag (or Alt-drag) and Cmd-scroll (or Alt-scroll) gestures. Pressing the 'R' key will reset pan/zoom to the default values.
Details Panel
The details panel appears when something of interest is "selected".
When a single device is selected, properties of that device are displayed, along with two action buttons:
- Show Related Traffic
- Show Device Flows
When multiple devices are selected, the details panel switches format to show the IDs of the selections and provides a single action button:
- Show Related Traffic
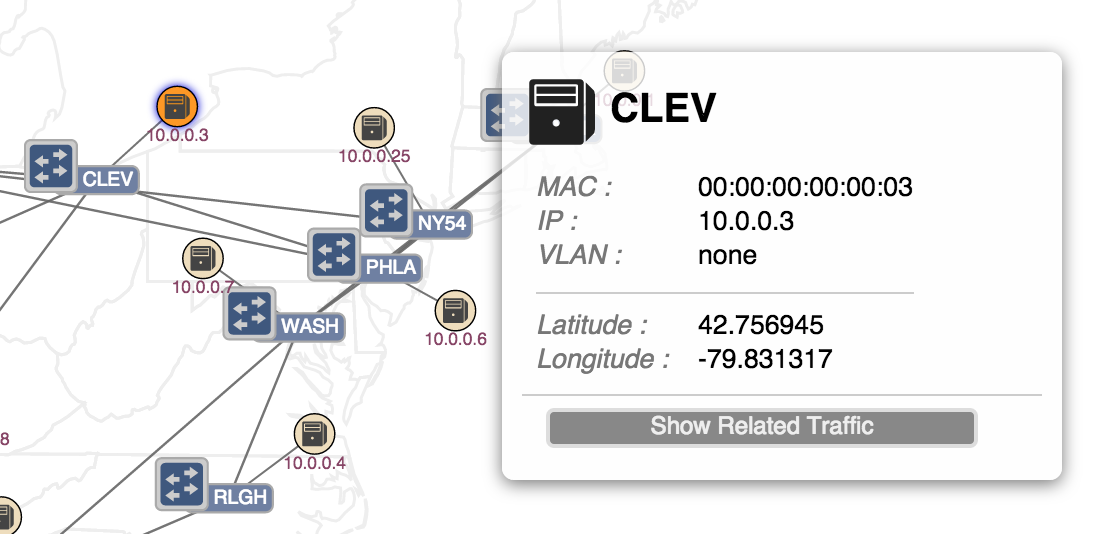
When a single host is selected, properties of that host are displayed, along with an action button:
- Show Related Traffic
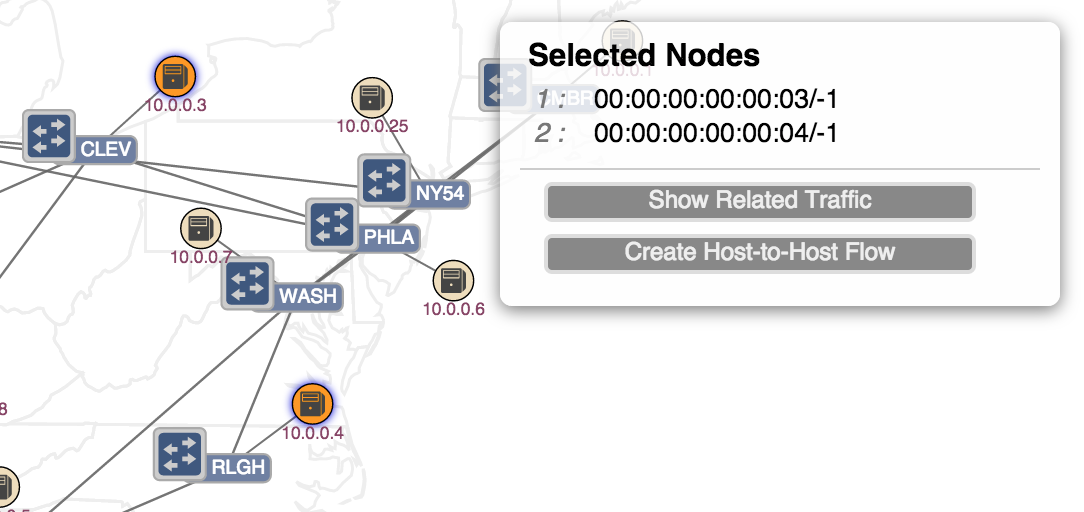
When exactly two hosts are selected, their IDs are shown, along with the following action buttons:
- Show Related Traffic
- Create Host-to-Host Flow
Visualizing Traffic
A number of commands allow different visualizations of traffic on the network.
All Traffic
If there is traffic flowing on the network (for example, if reactive forwarding is active, and a pingall is run on mininet), then pressing the 'A' key will display something like the following:
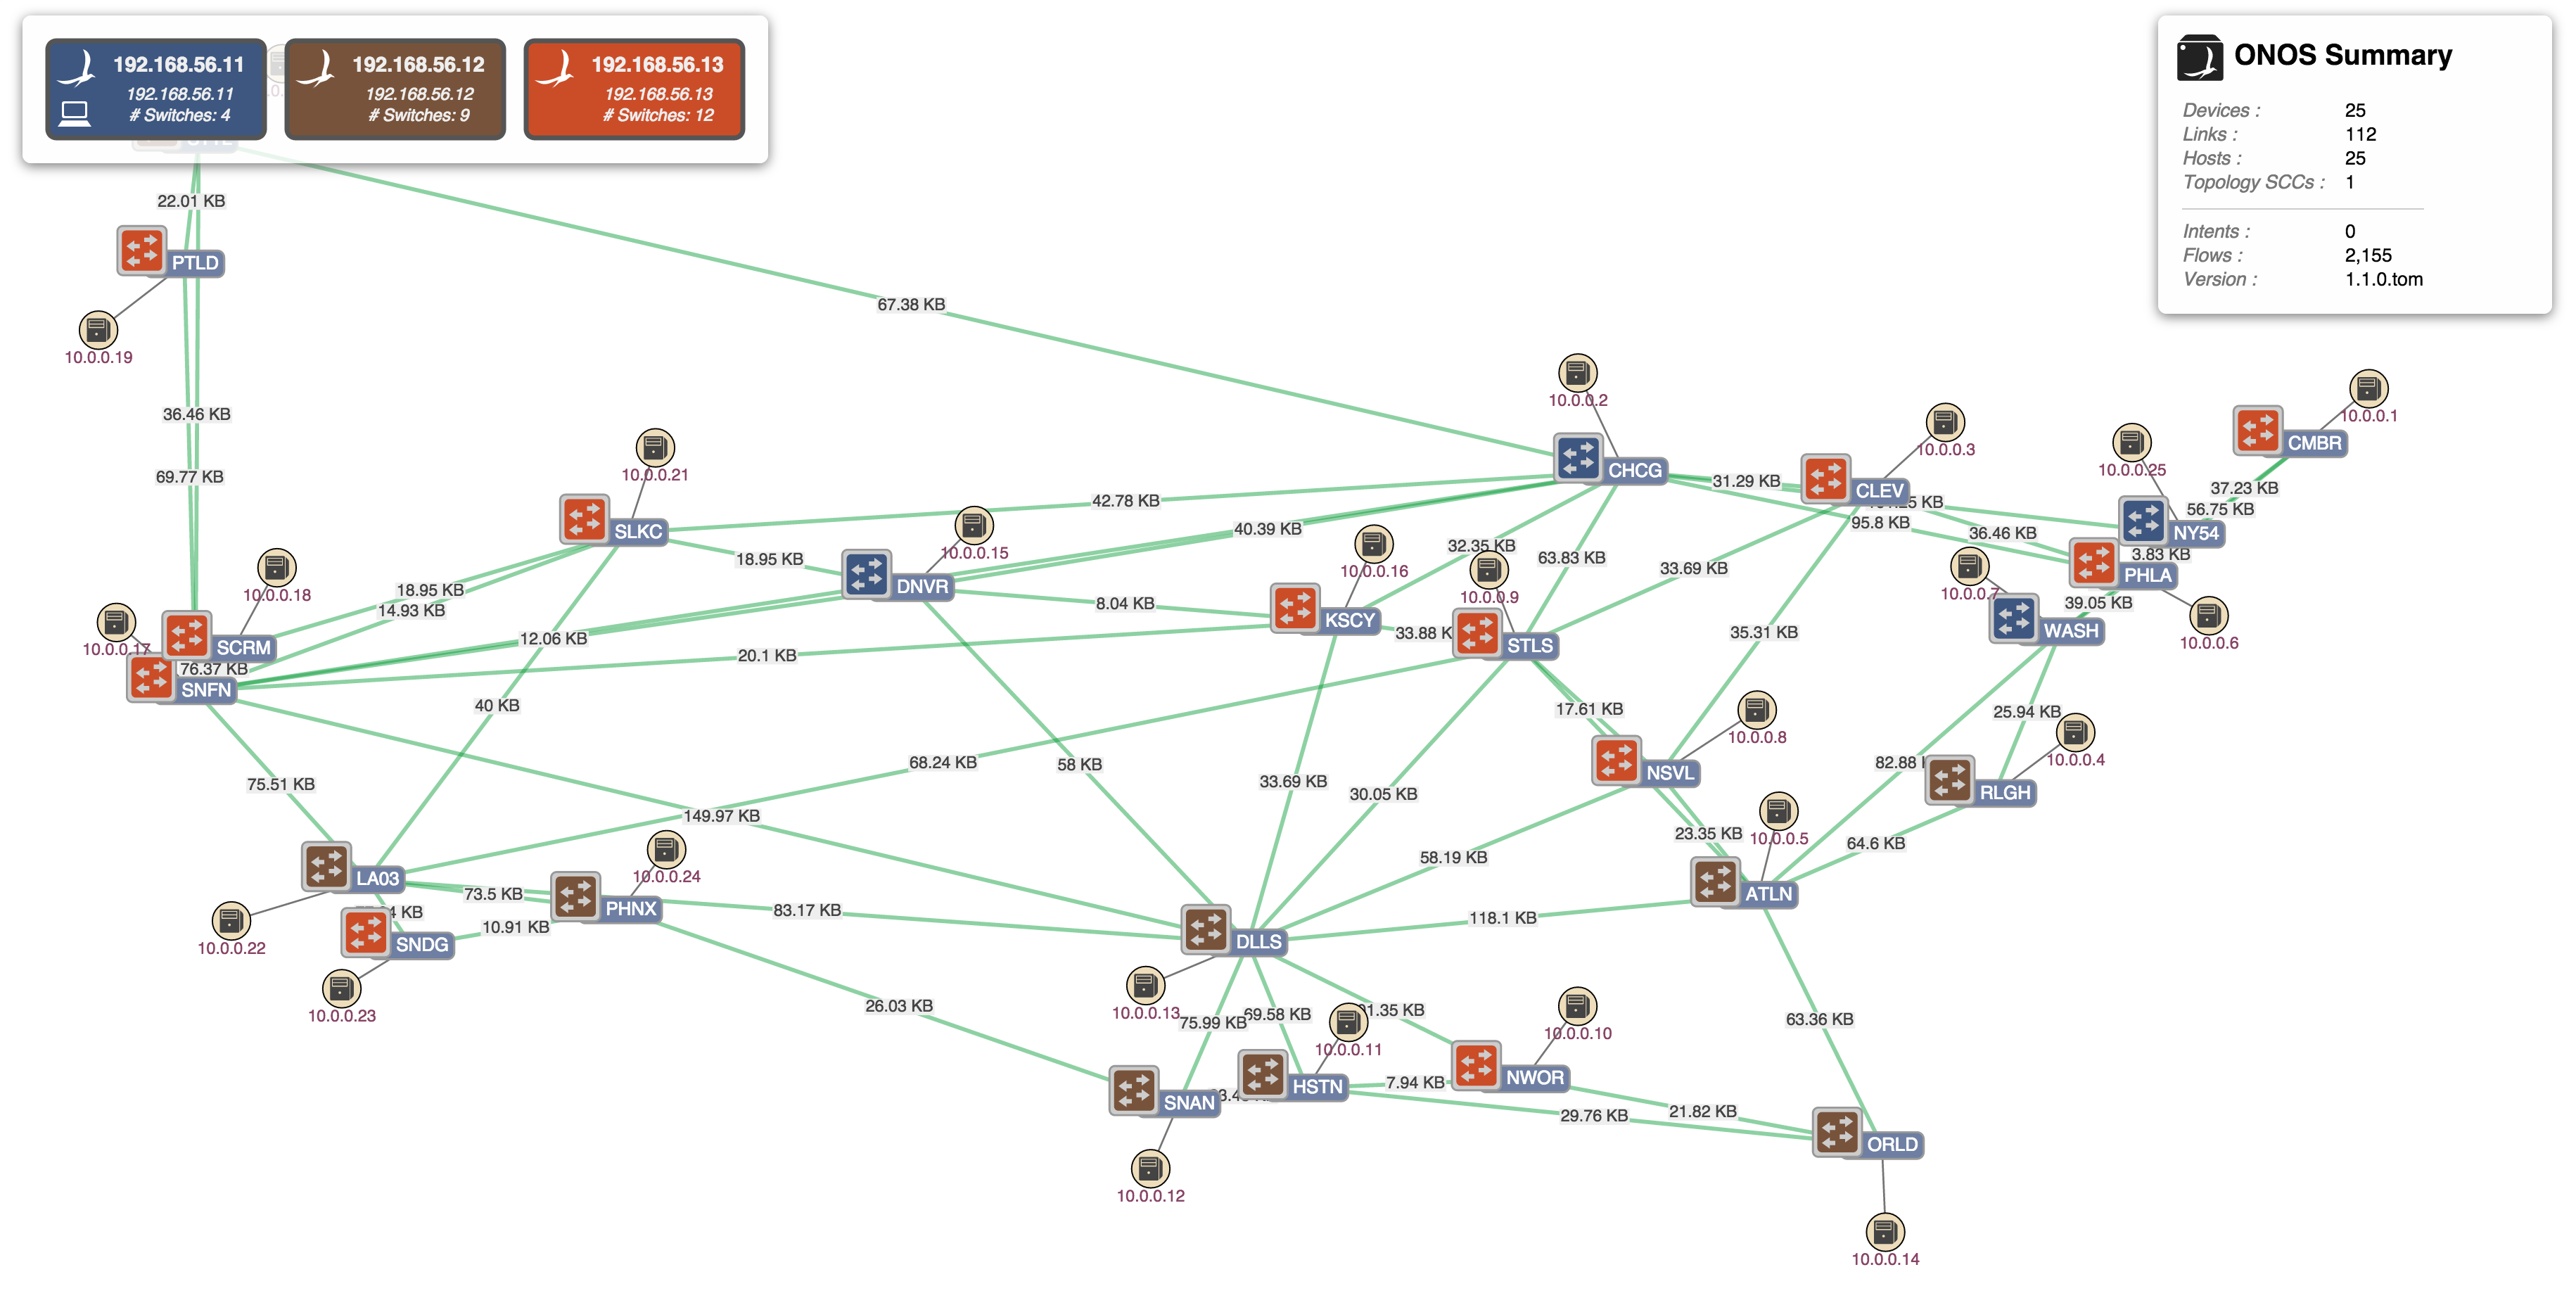
Note that the labels on the links show the cumulative number of bytes traversing that link since traffic monitoring was requested, (i.e. since the 'A' key was pressed).
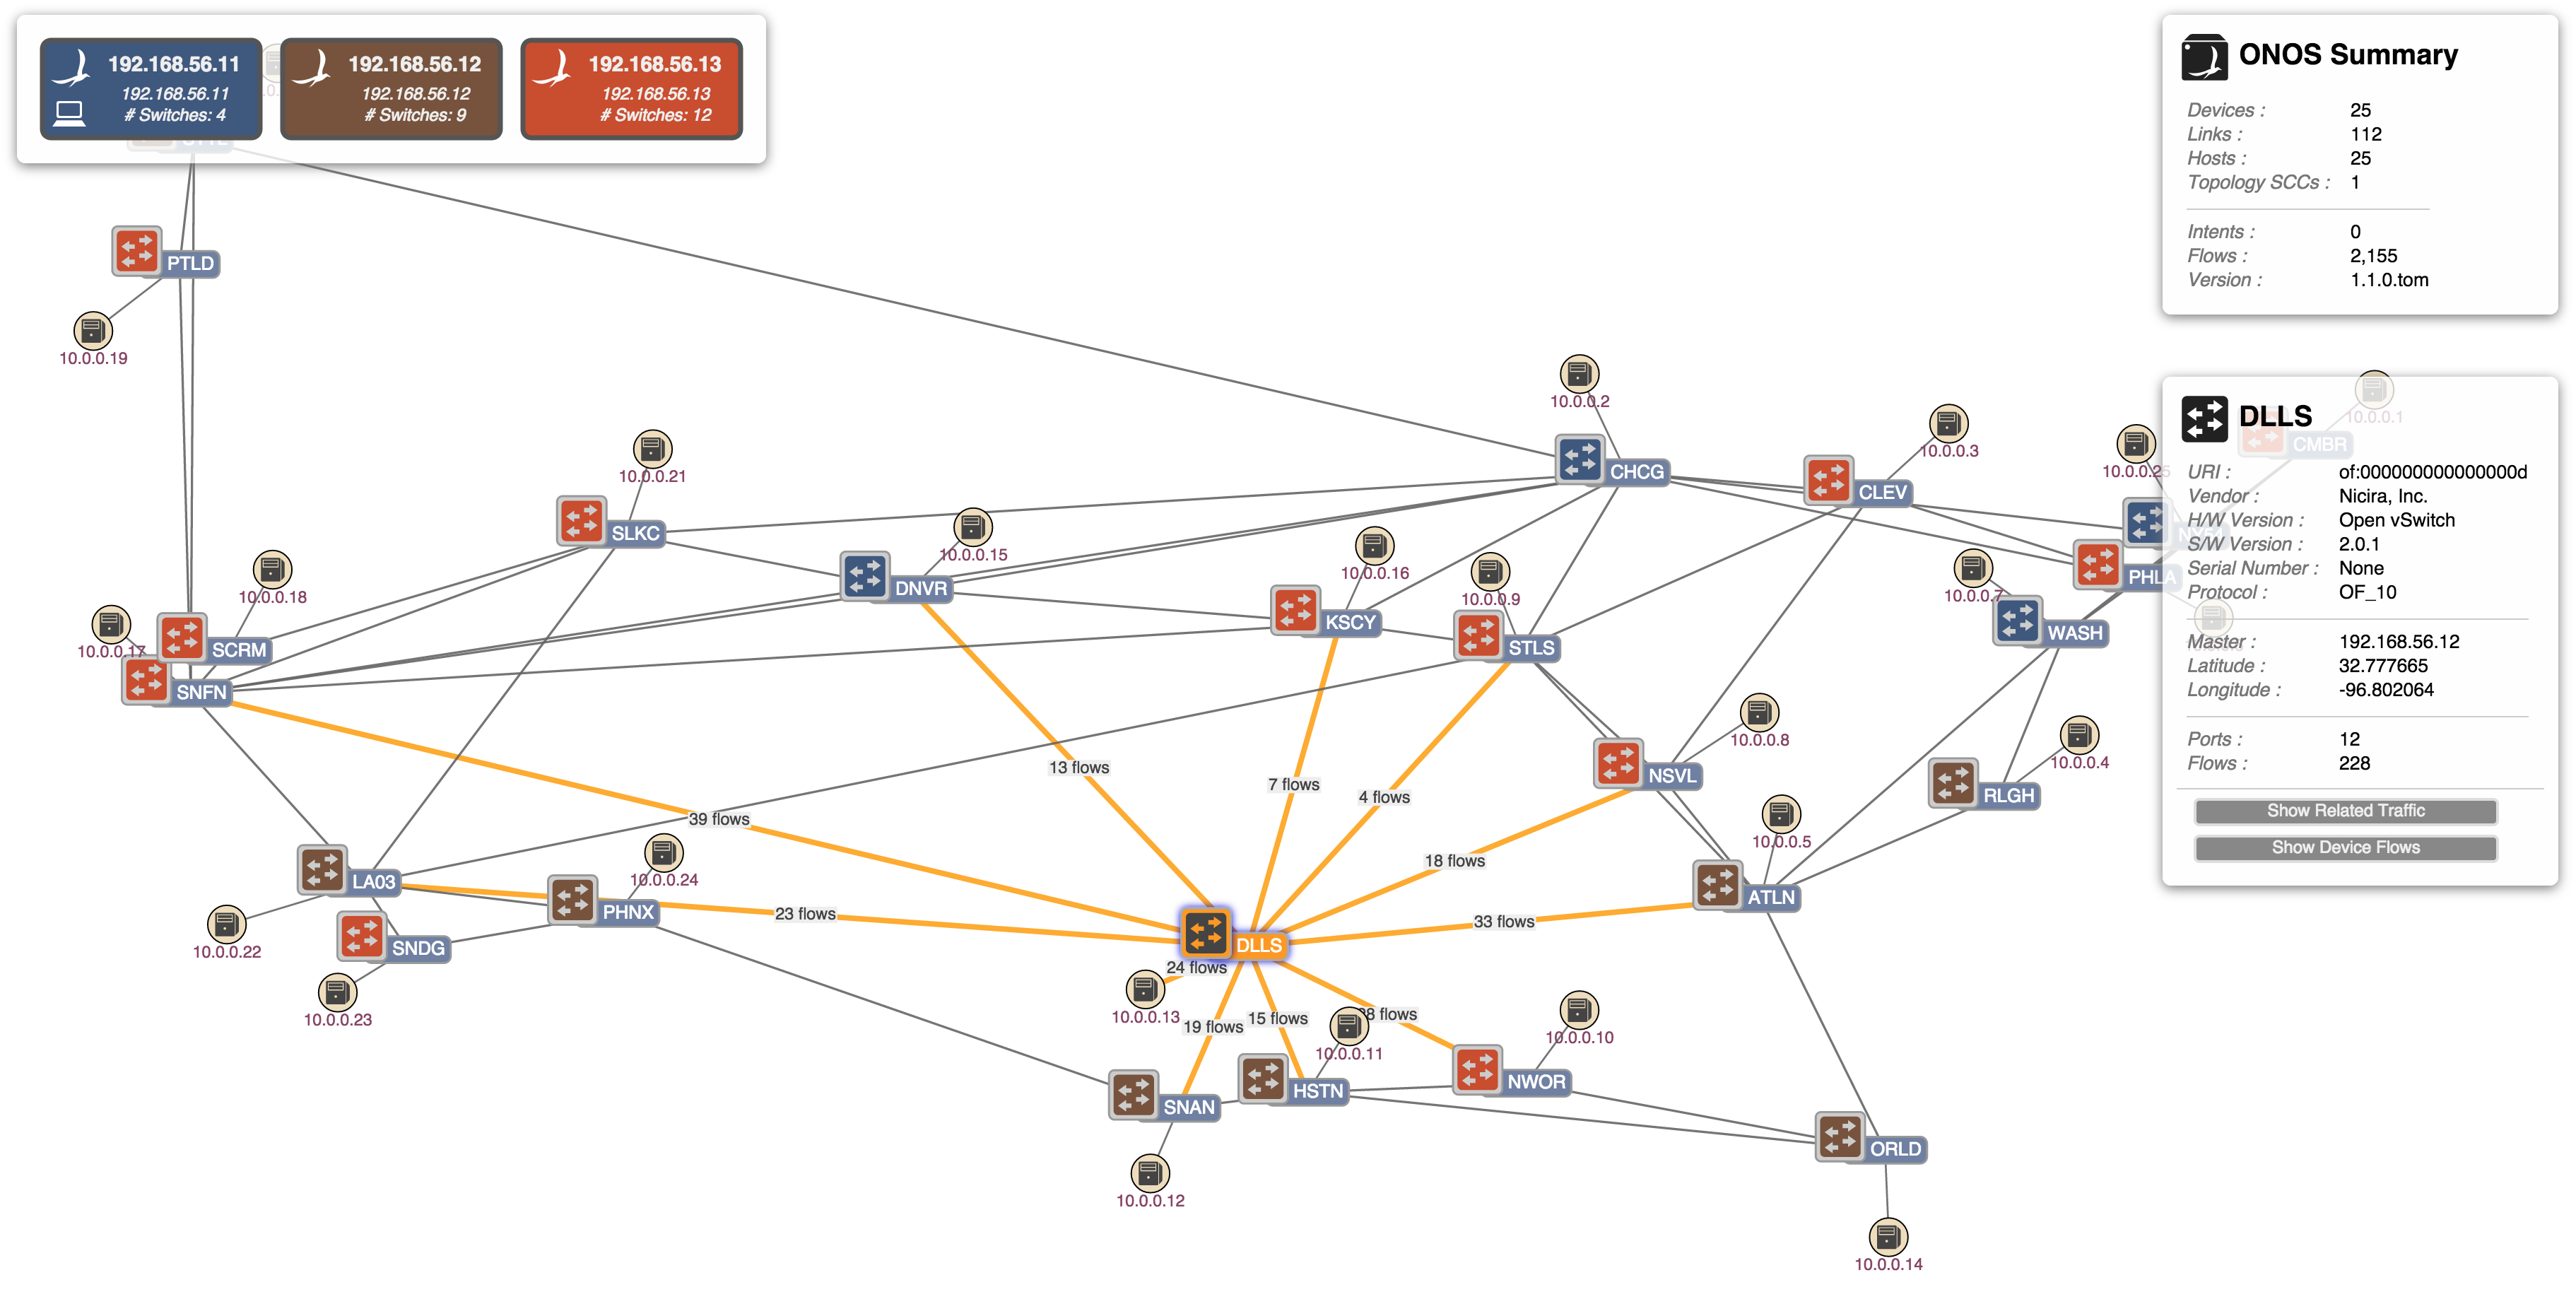
Device Link Flows
If a specific device is selected, and the 'F' key pressed, then the number of flows egressing from the device will be shown:
Host to Host Intent
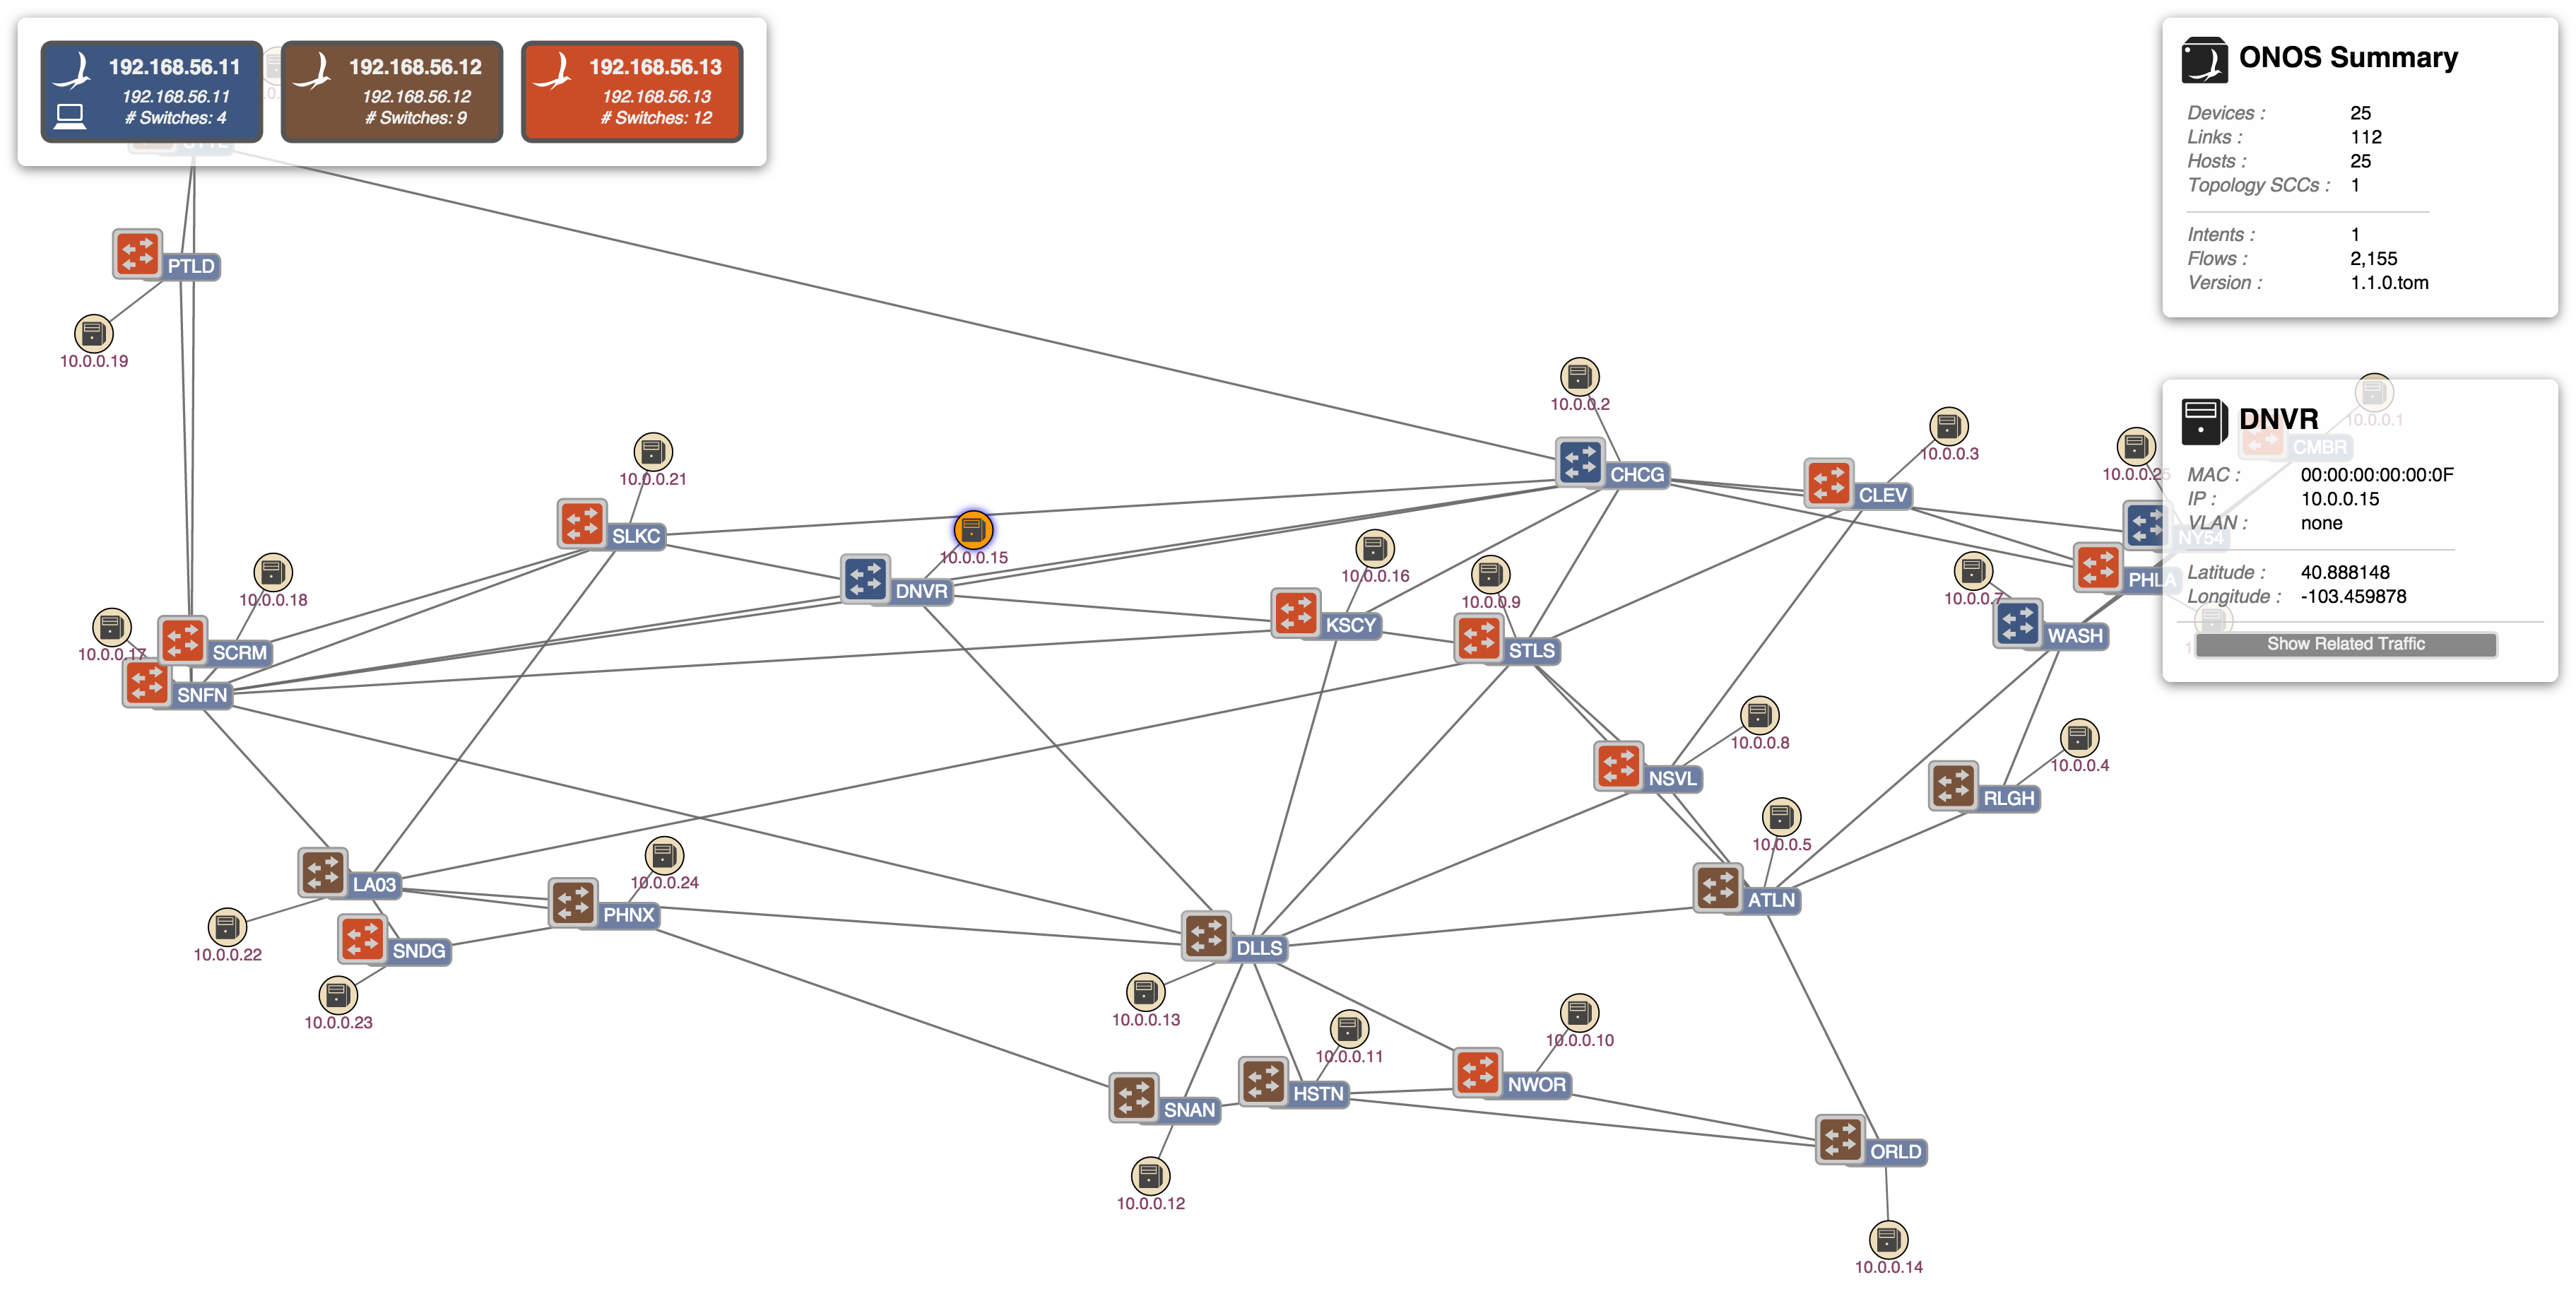
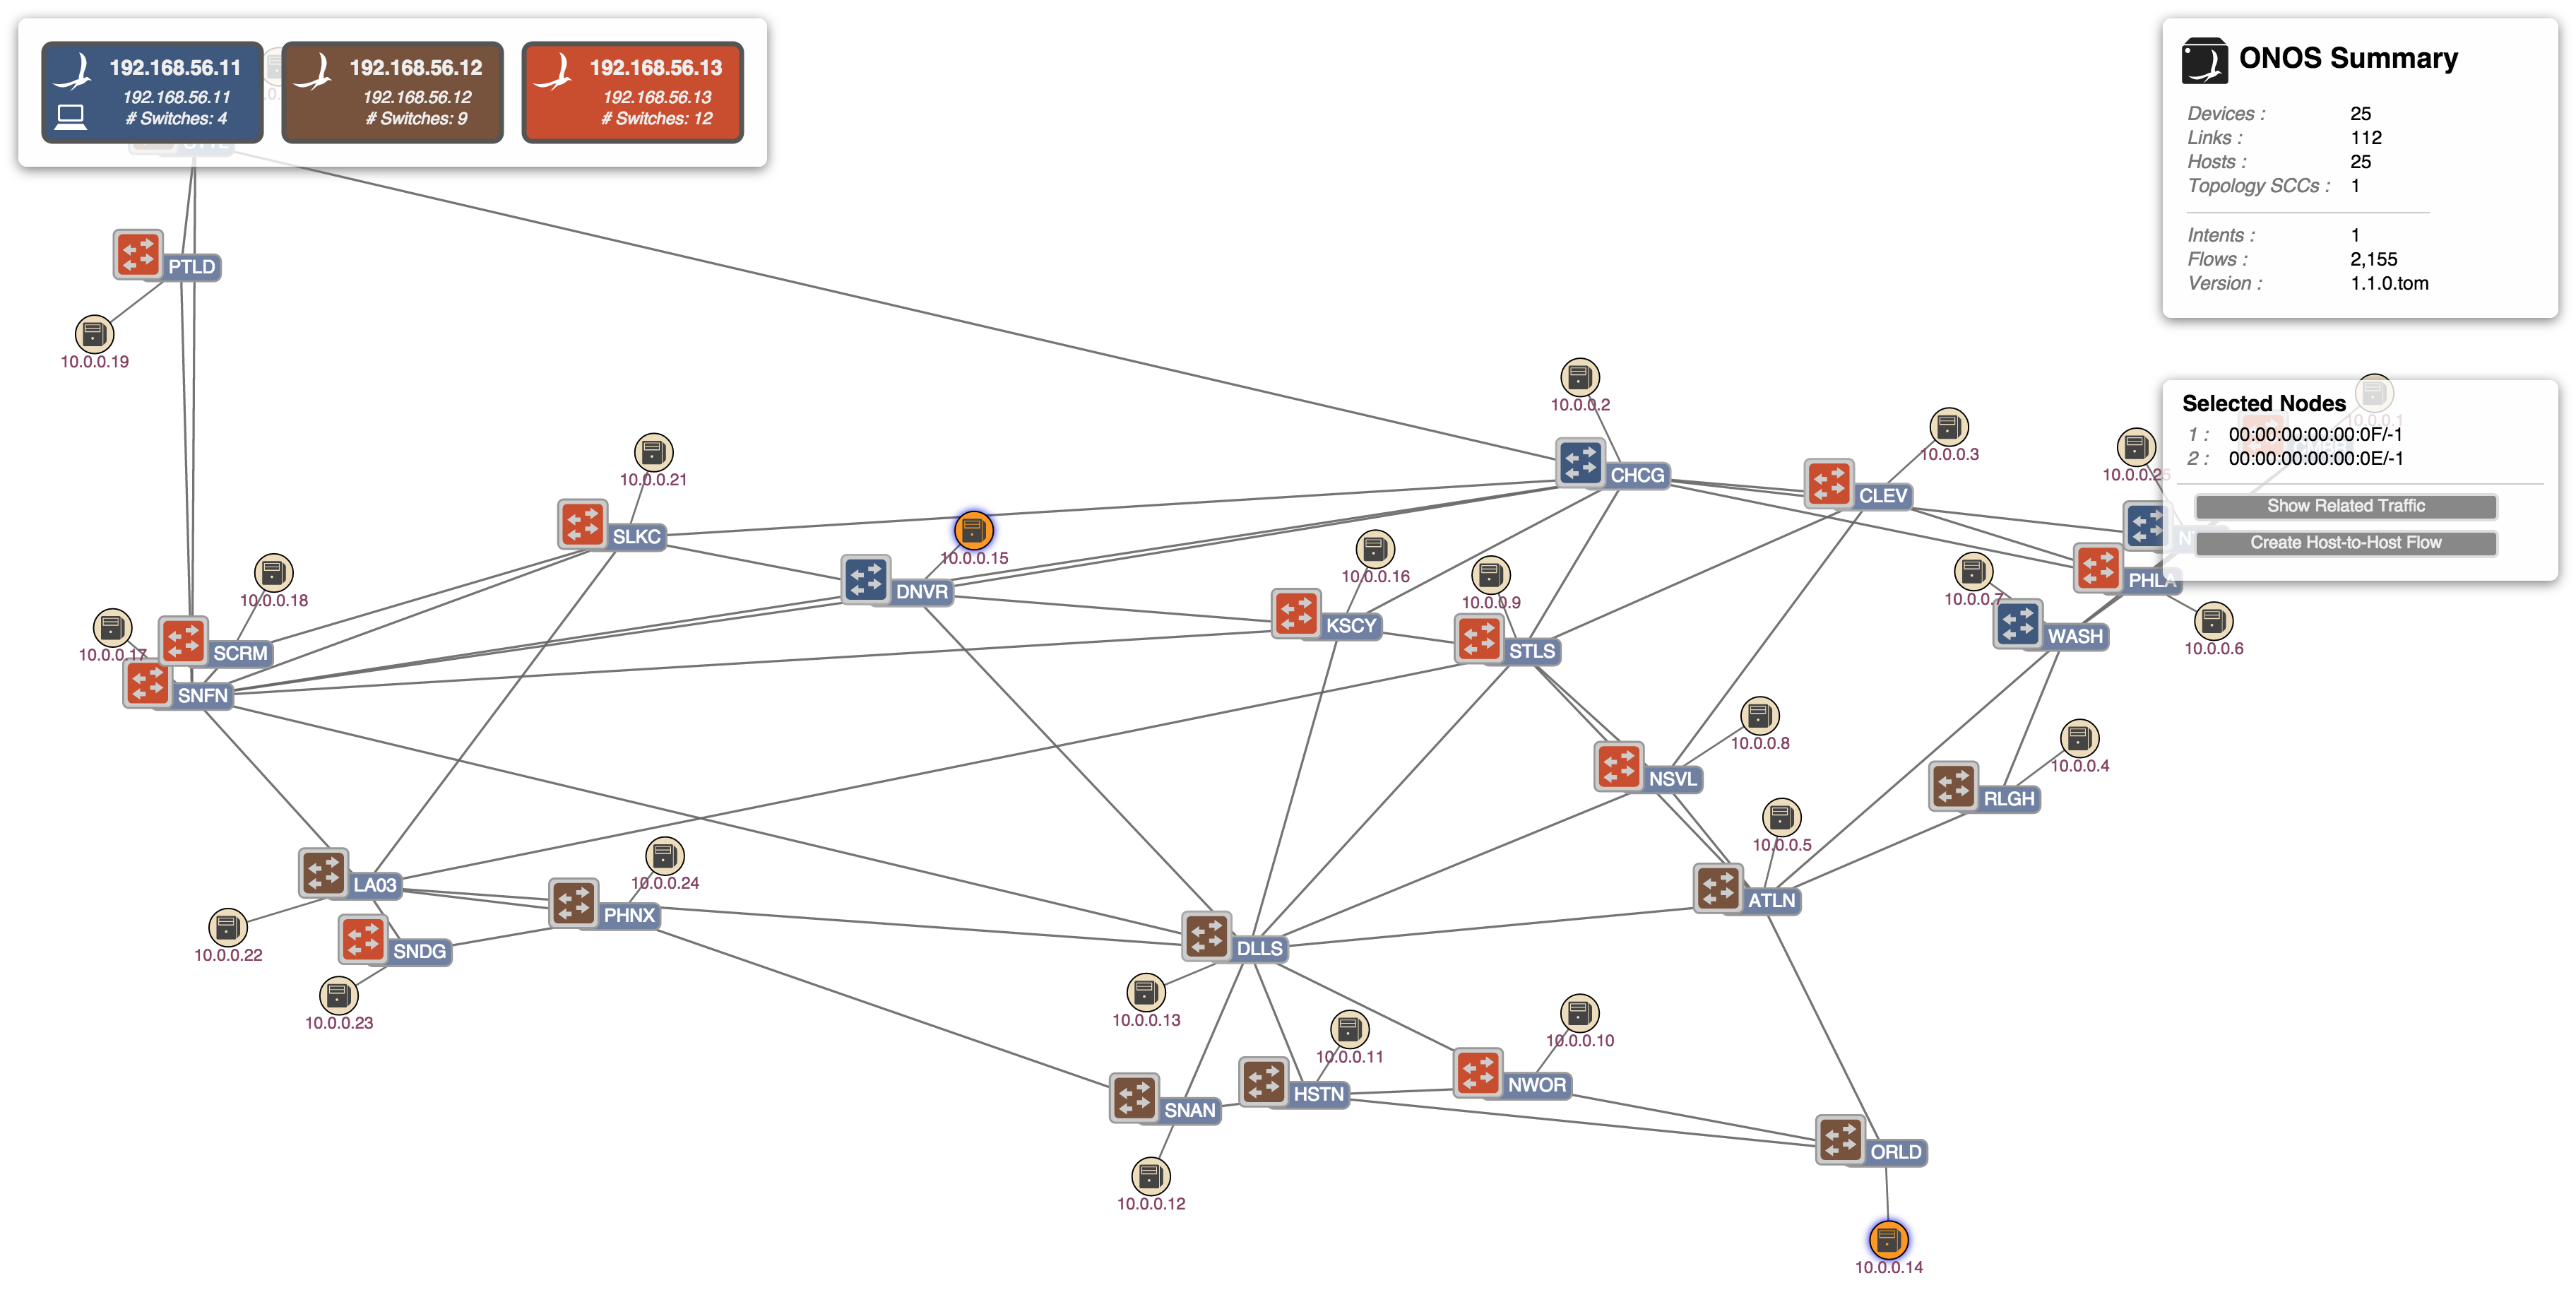
The following 4 images show the selection of two hosts and the installation of a host-to-host intent:
(1) Host (.15) at Denver (DNVR) is selected:
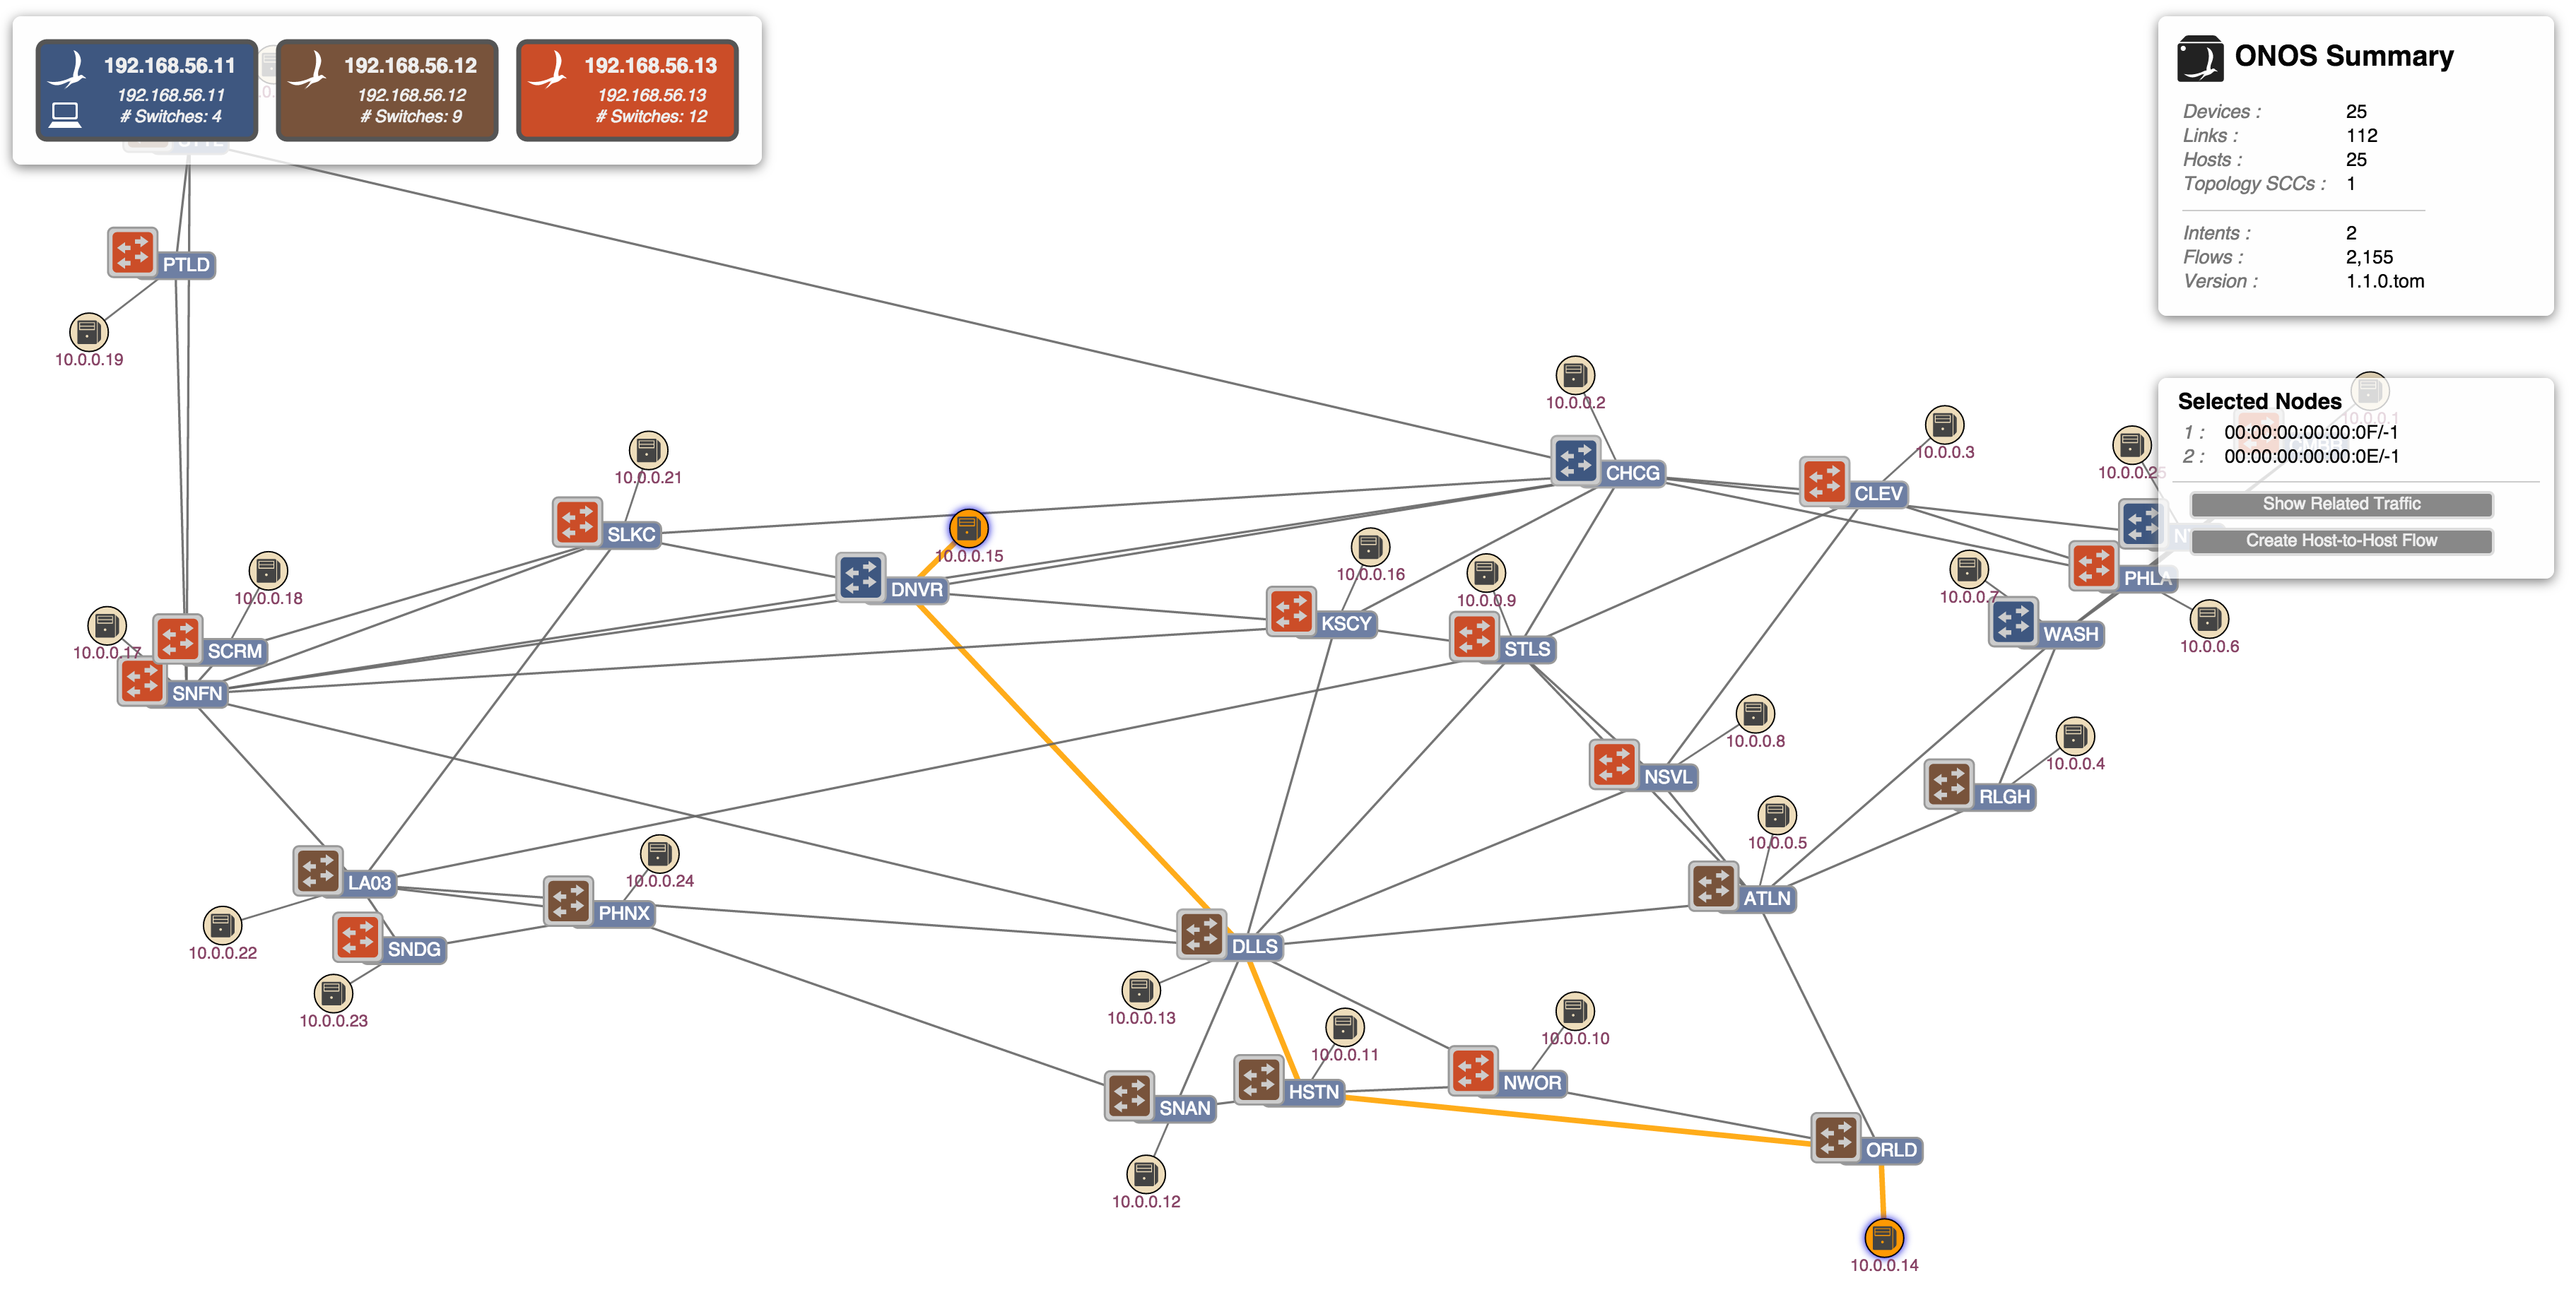
(2) Host (.14) at Orlando (ORLD) is selected:
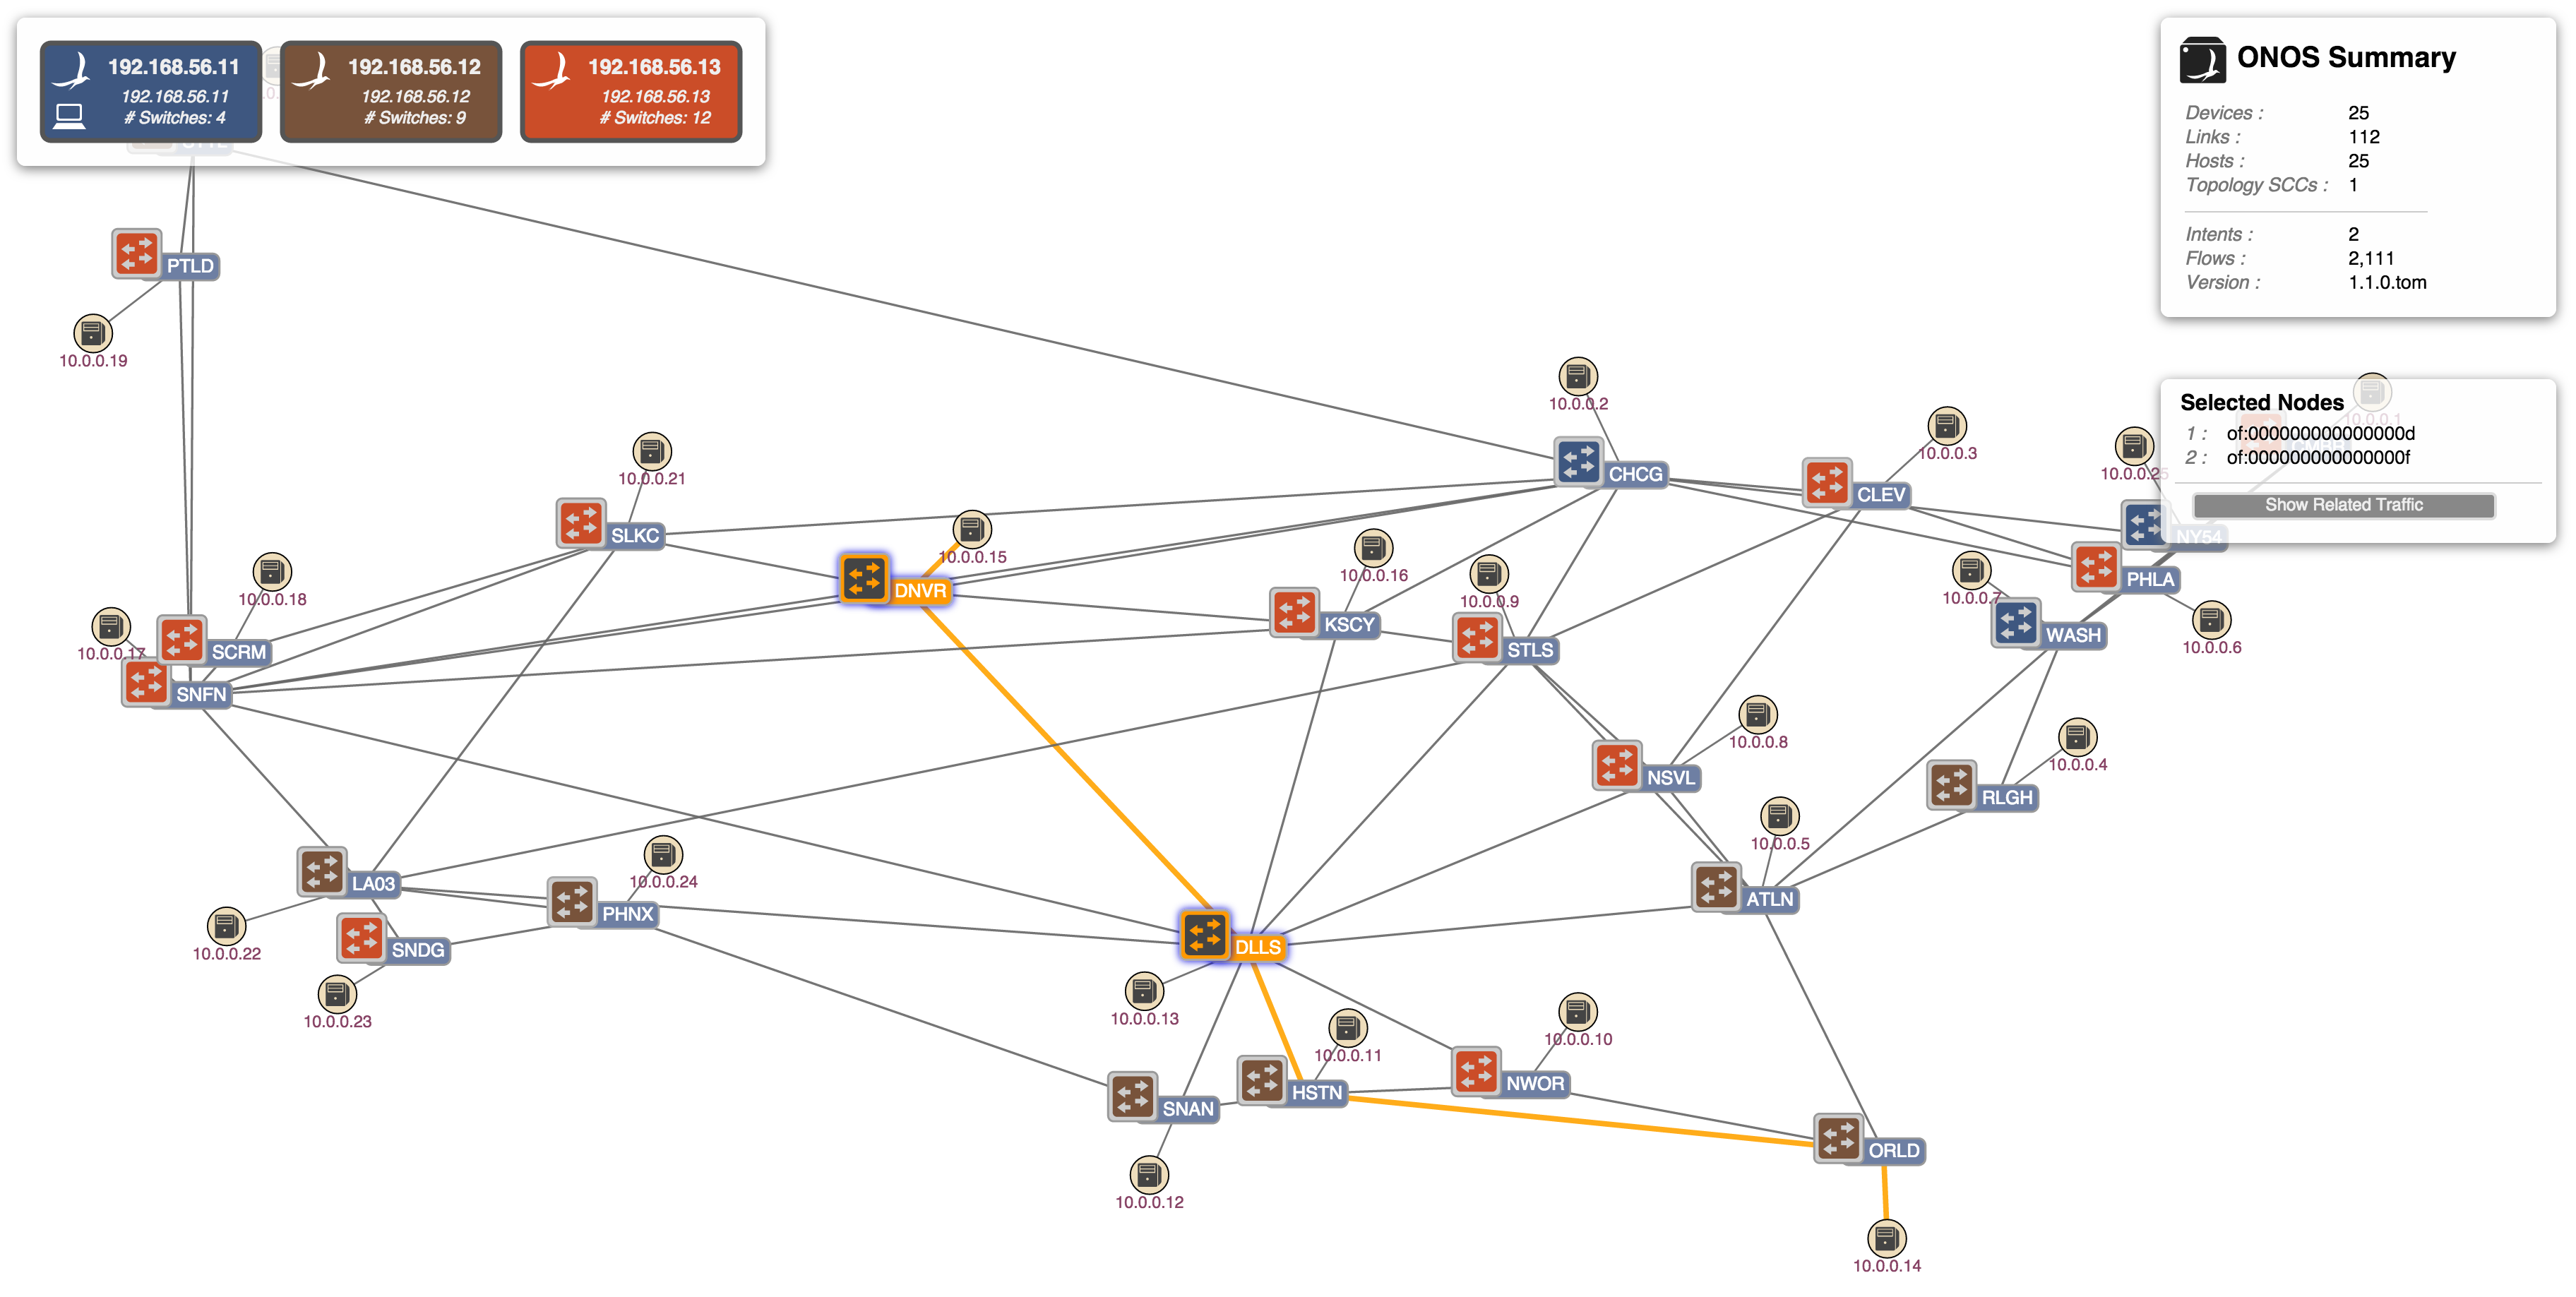
(3) "Create Host-to-Host Flow" action button pressed (on Detail Panel):
(4) Monitor traffic of selected intent ('W' key pressed). Note the traffic showing as labels on the links:

Show Related Intents
If a device is selected, pressing the 'V' key will show all related intents, i.e. all intents for which the selected device is a part. Note that if multiple devices are selected, a logical AND operation is applied, meaning that only those intents for which all the selected devices are a part will be highlighted.
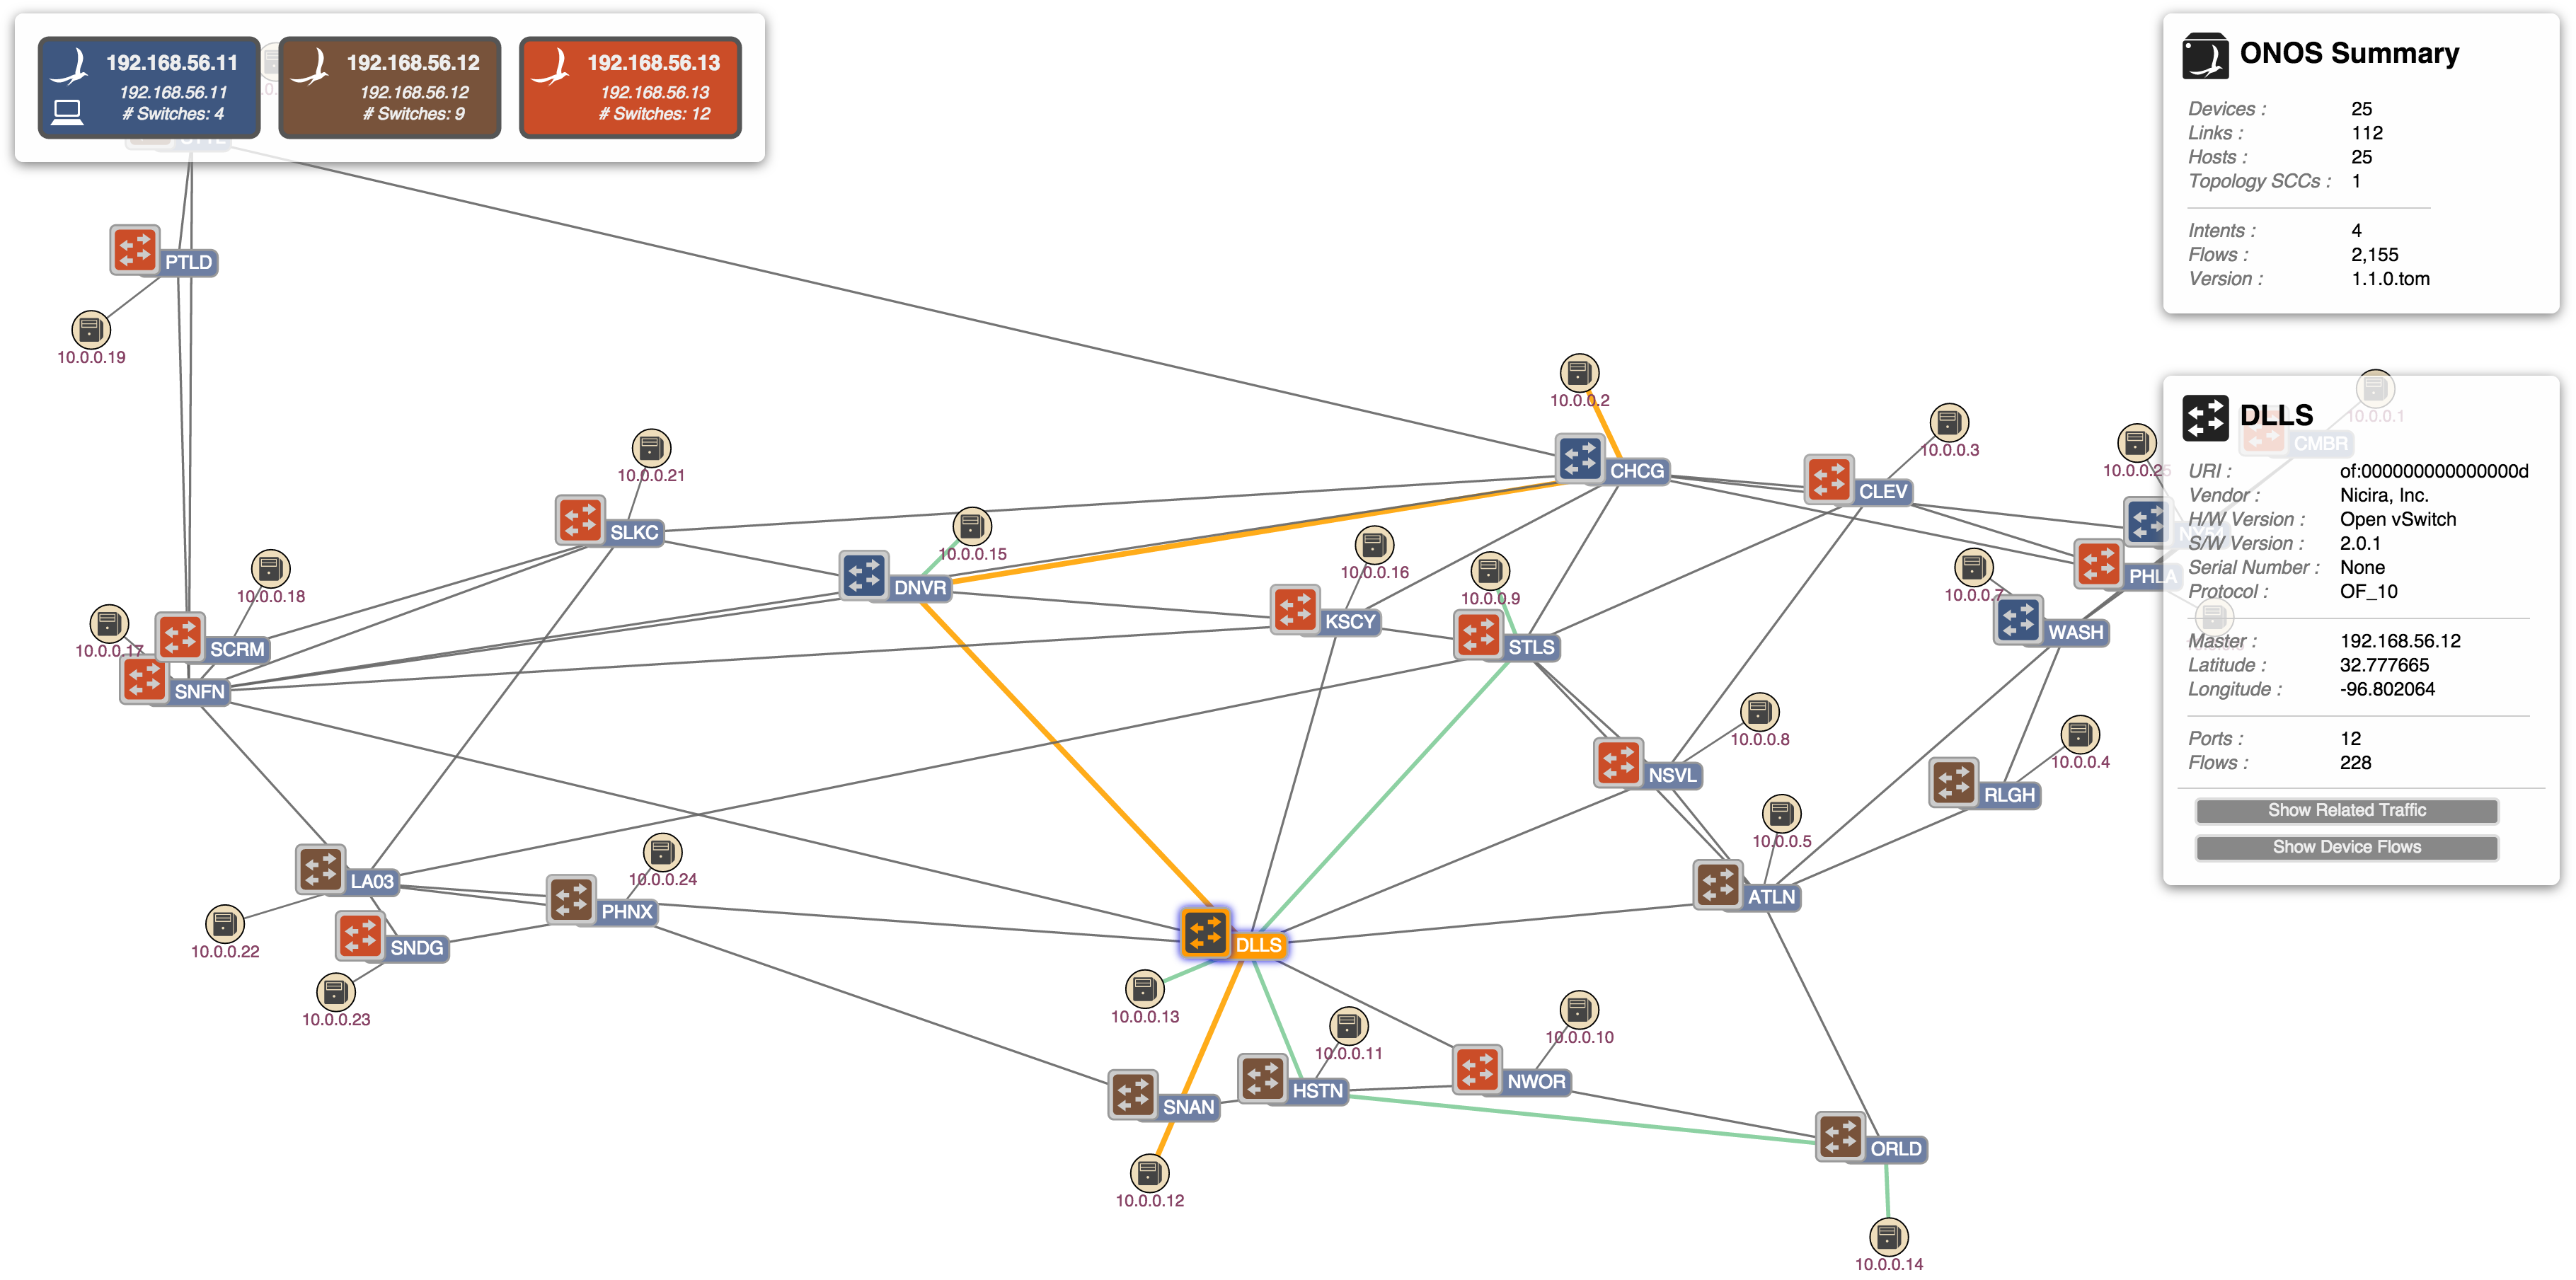
(1) Related intent which passes through both Denver (DNVR) and Dallas (DLLS):
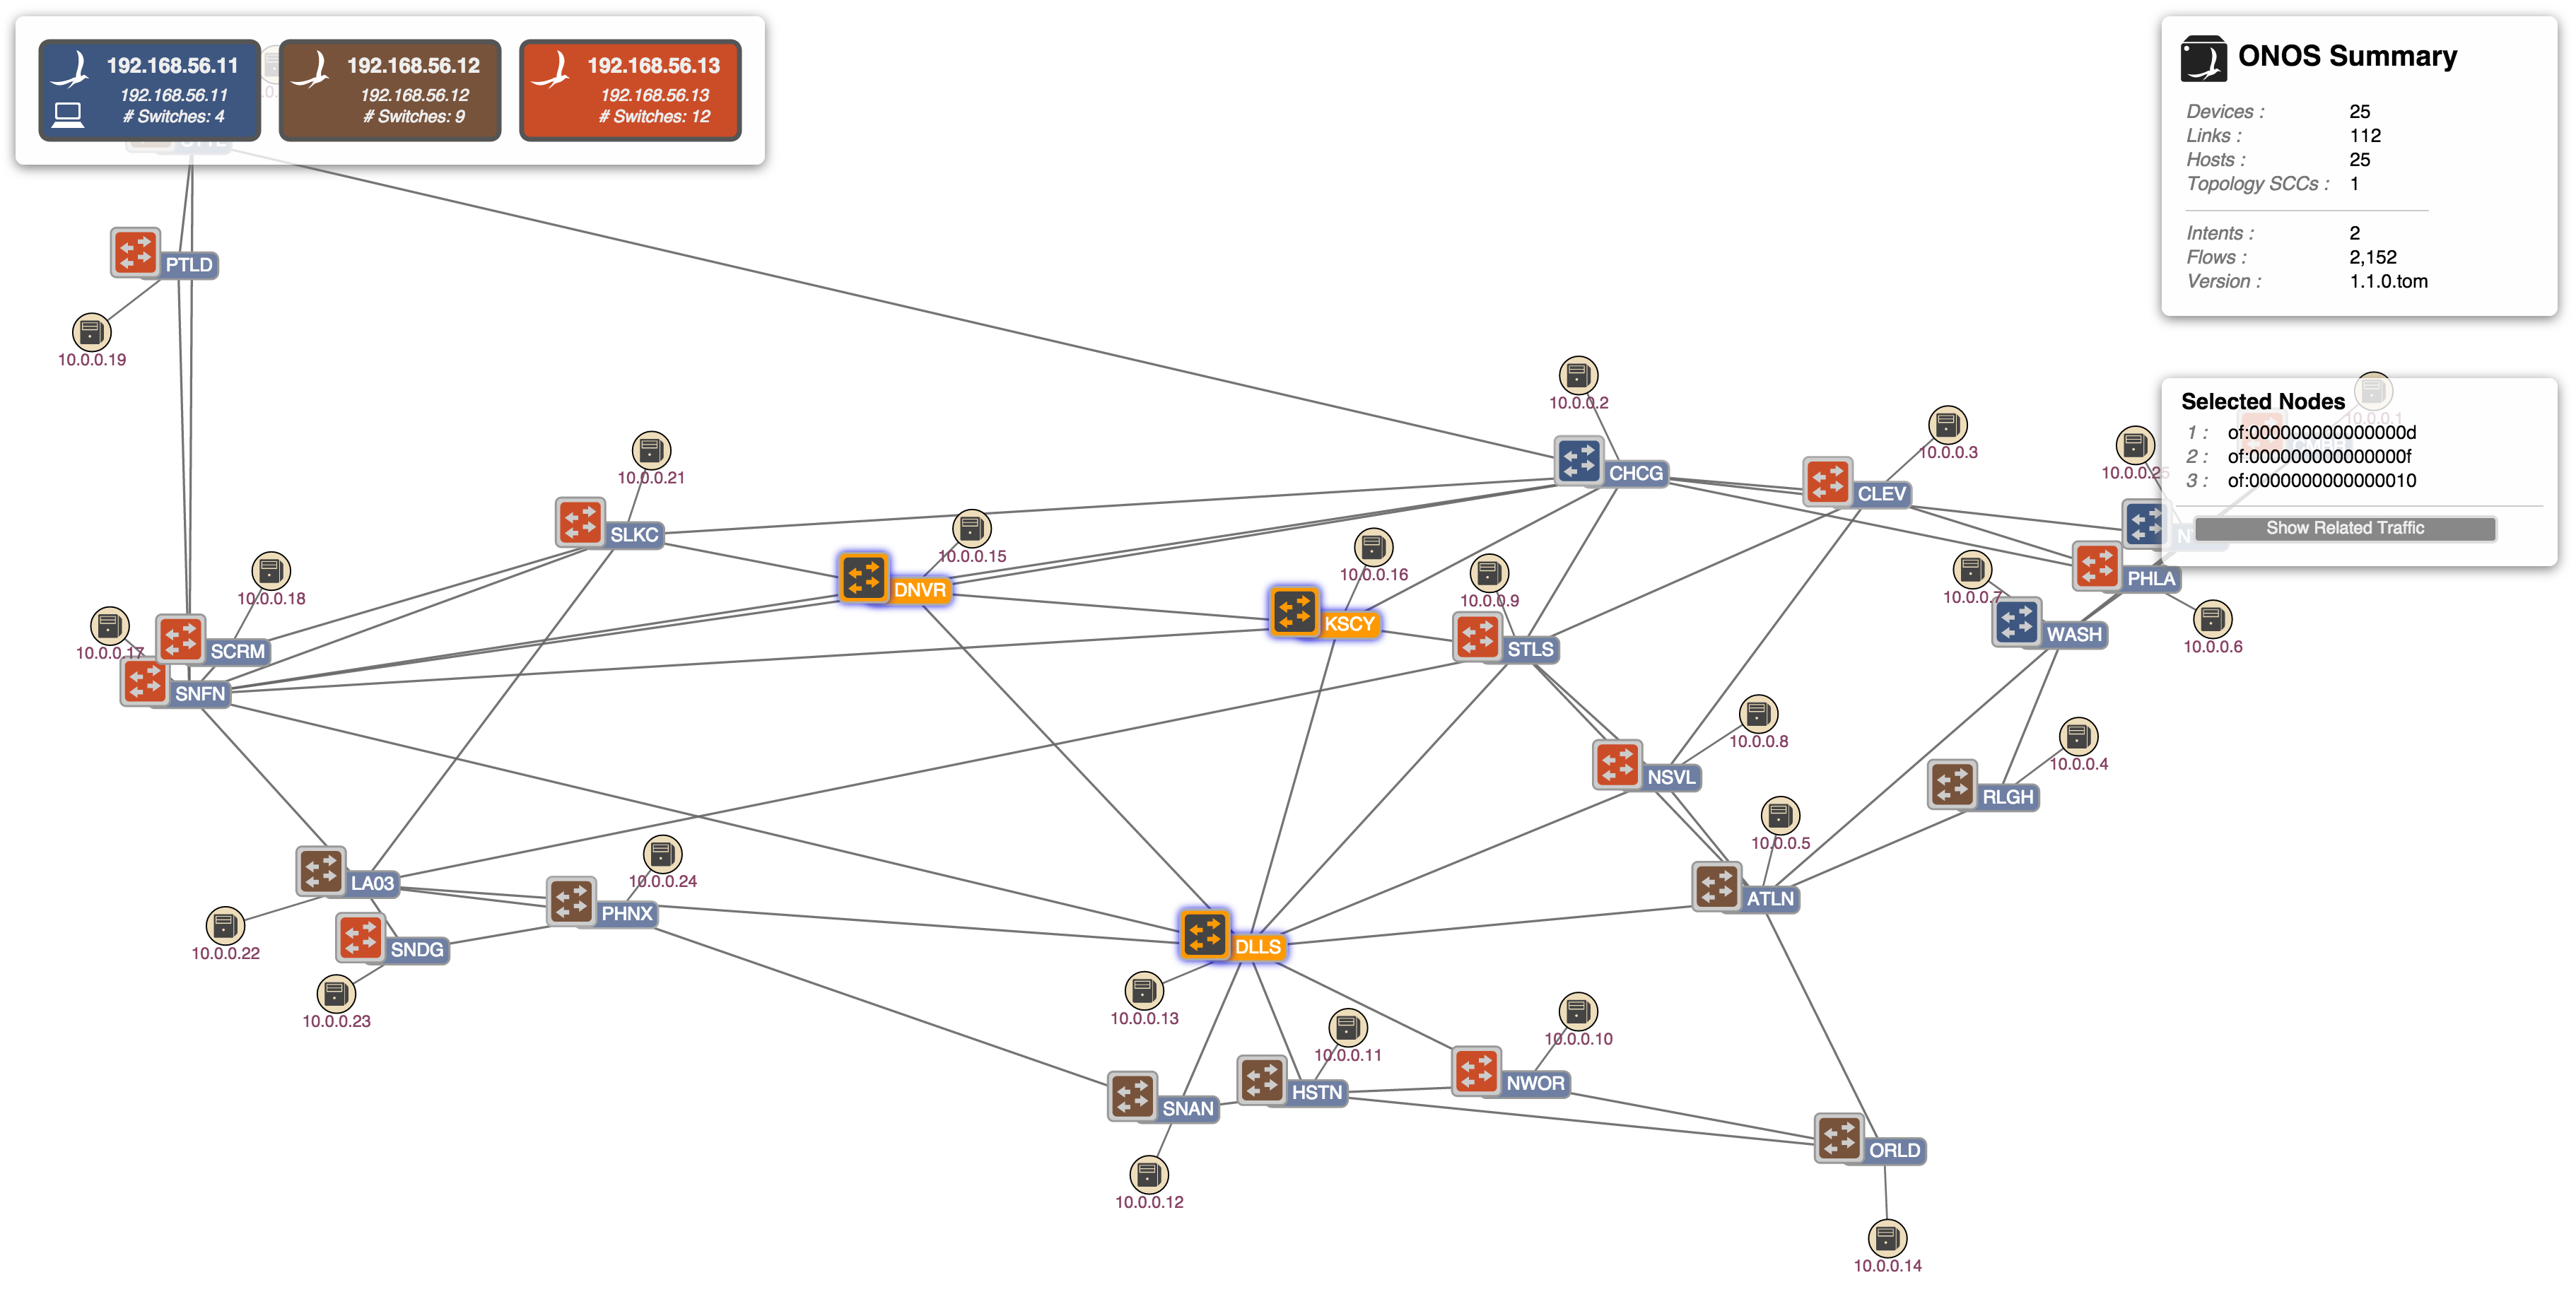
(2) There are no related intents that pass through Denver (DNVR), Dallas (DLLS), and Kansas City (KSCY):
A Set of Related Intents
It is quite probable that a device will be associated with a set of intents. For our example here, let's set up two more host-to-host intents that pass through Dallas:
(1) From host (.13) at Dallas (DLLS) to host (.9) at St Louis (STLS):
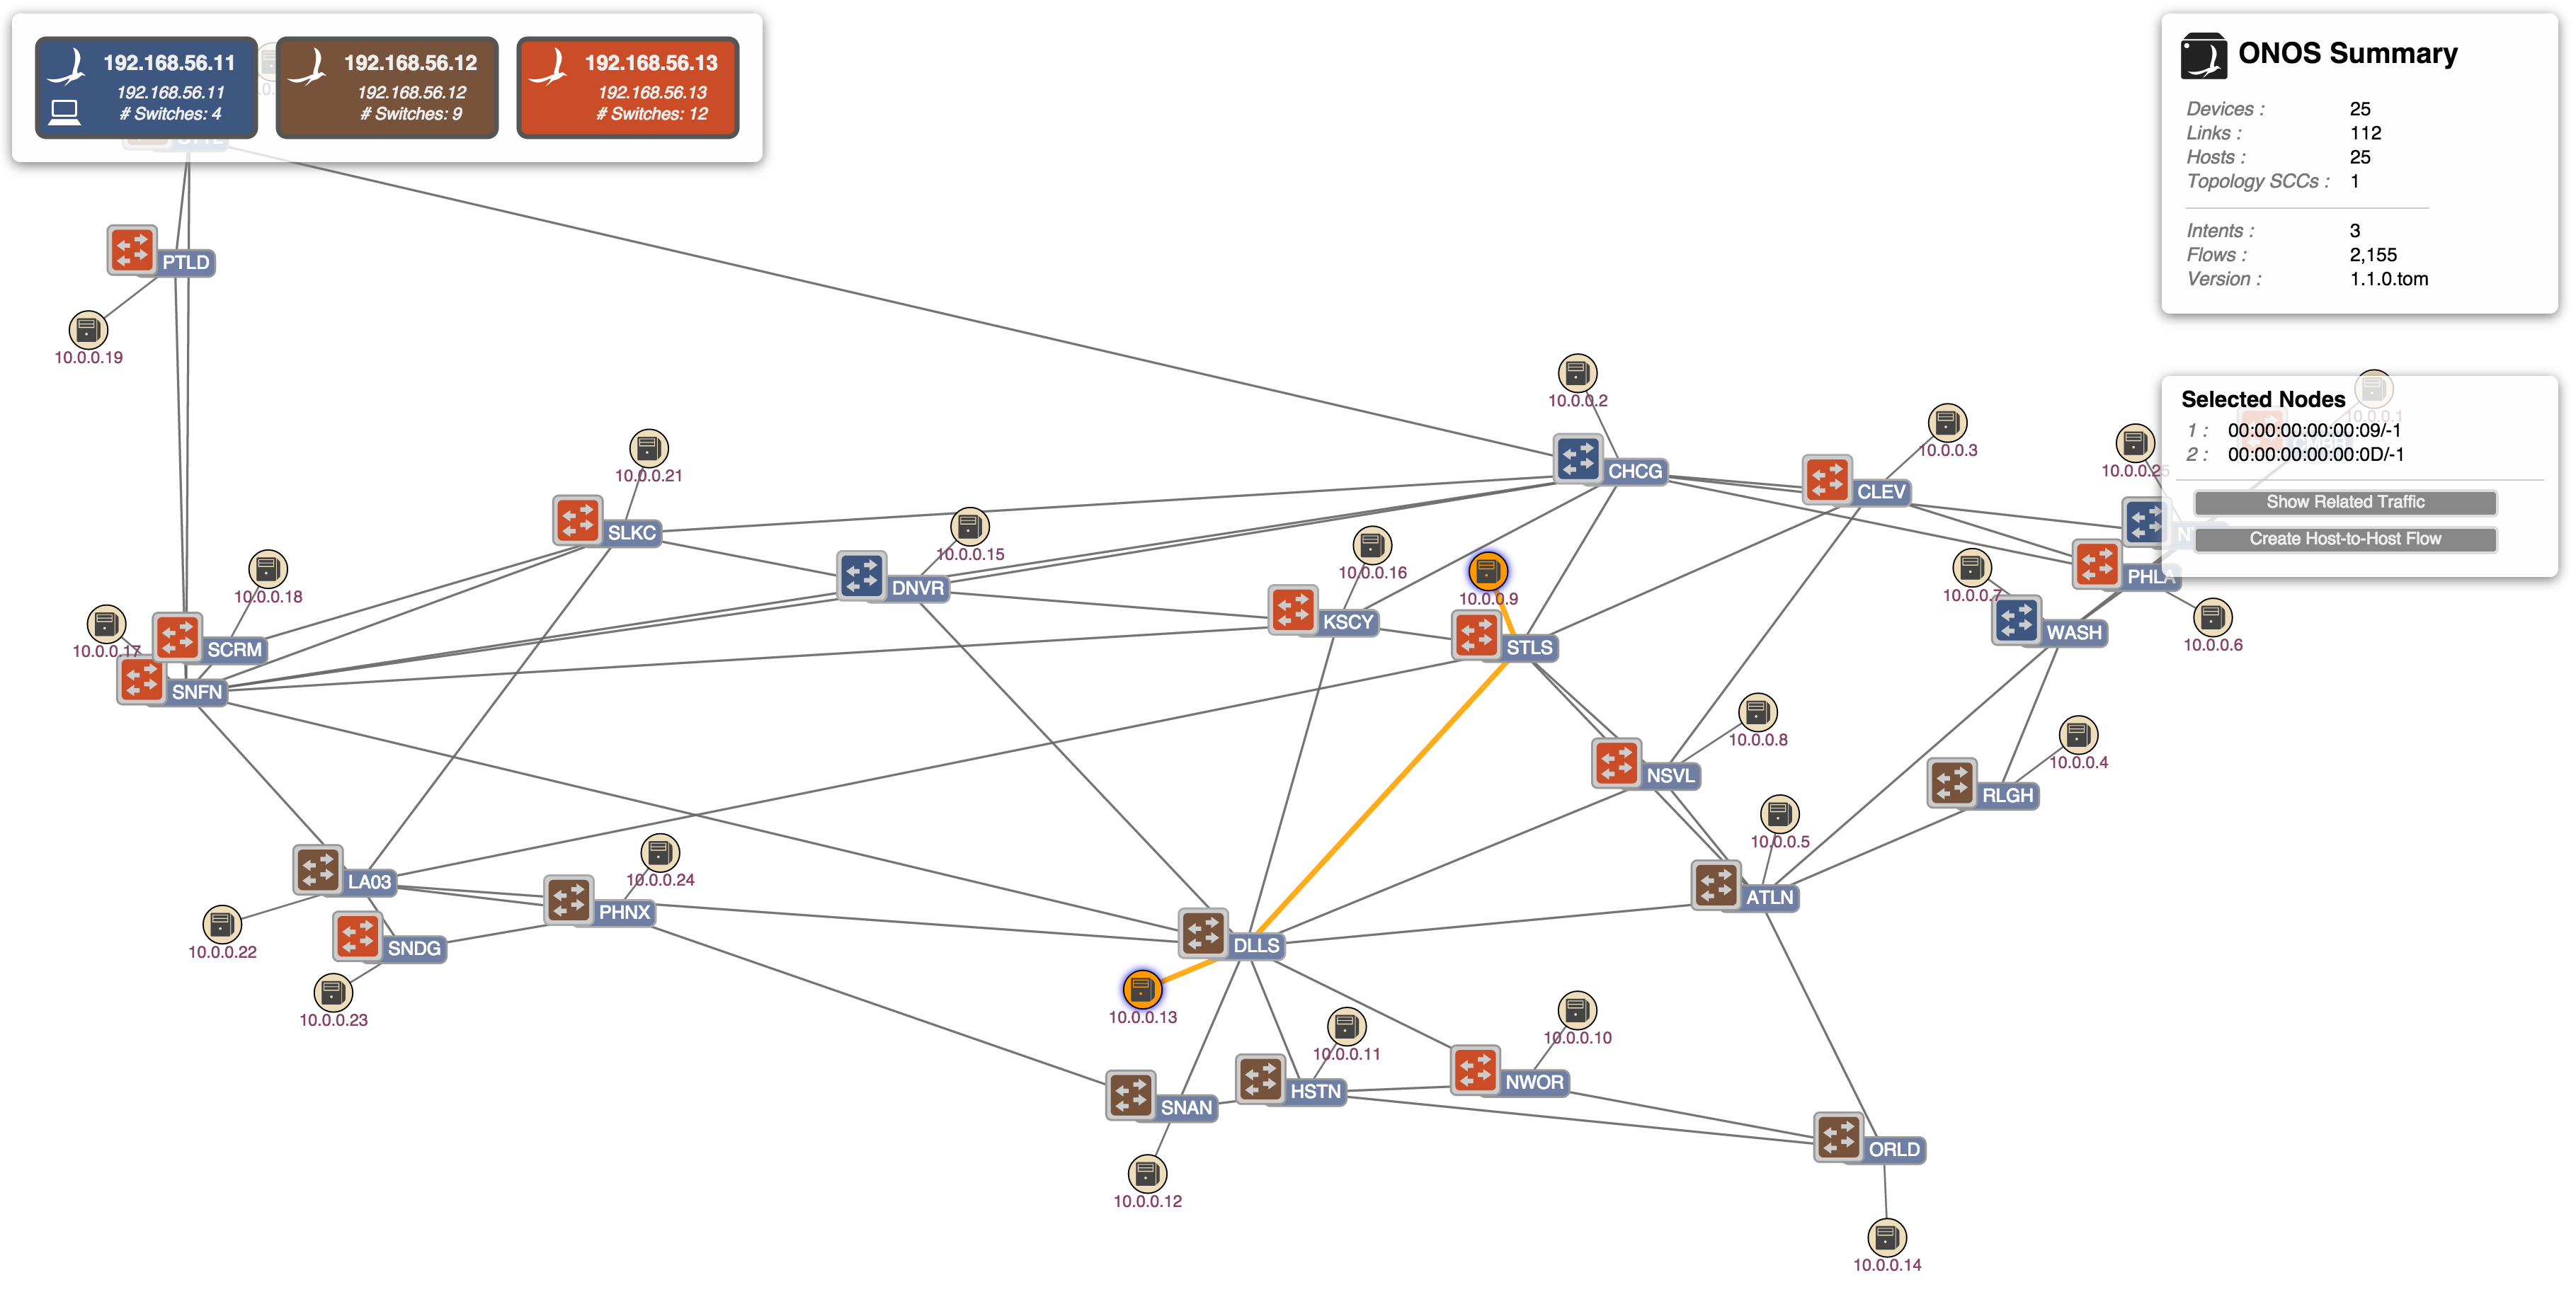
(2) From host (.12) at San Antonio (SNAN) to host (.2) at Chicago (CHCG):
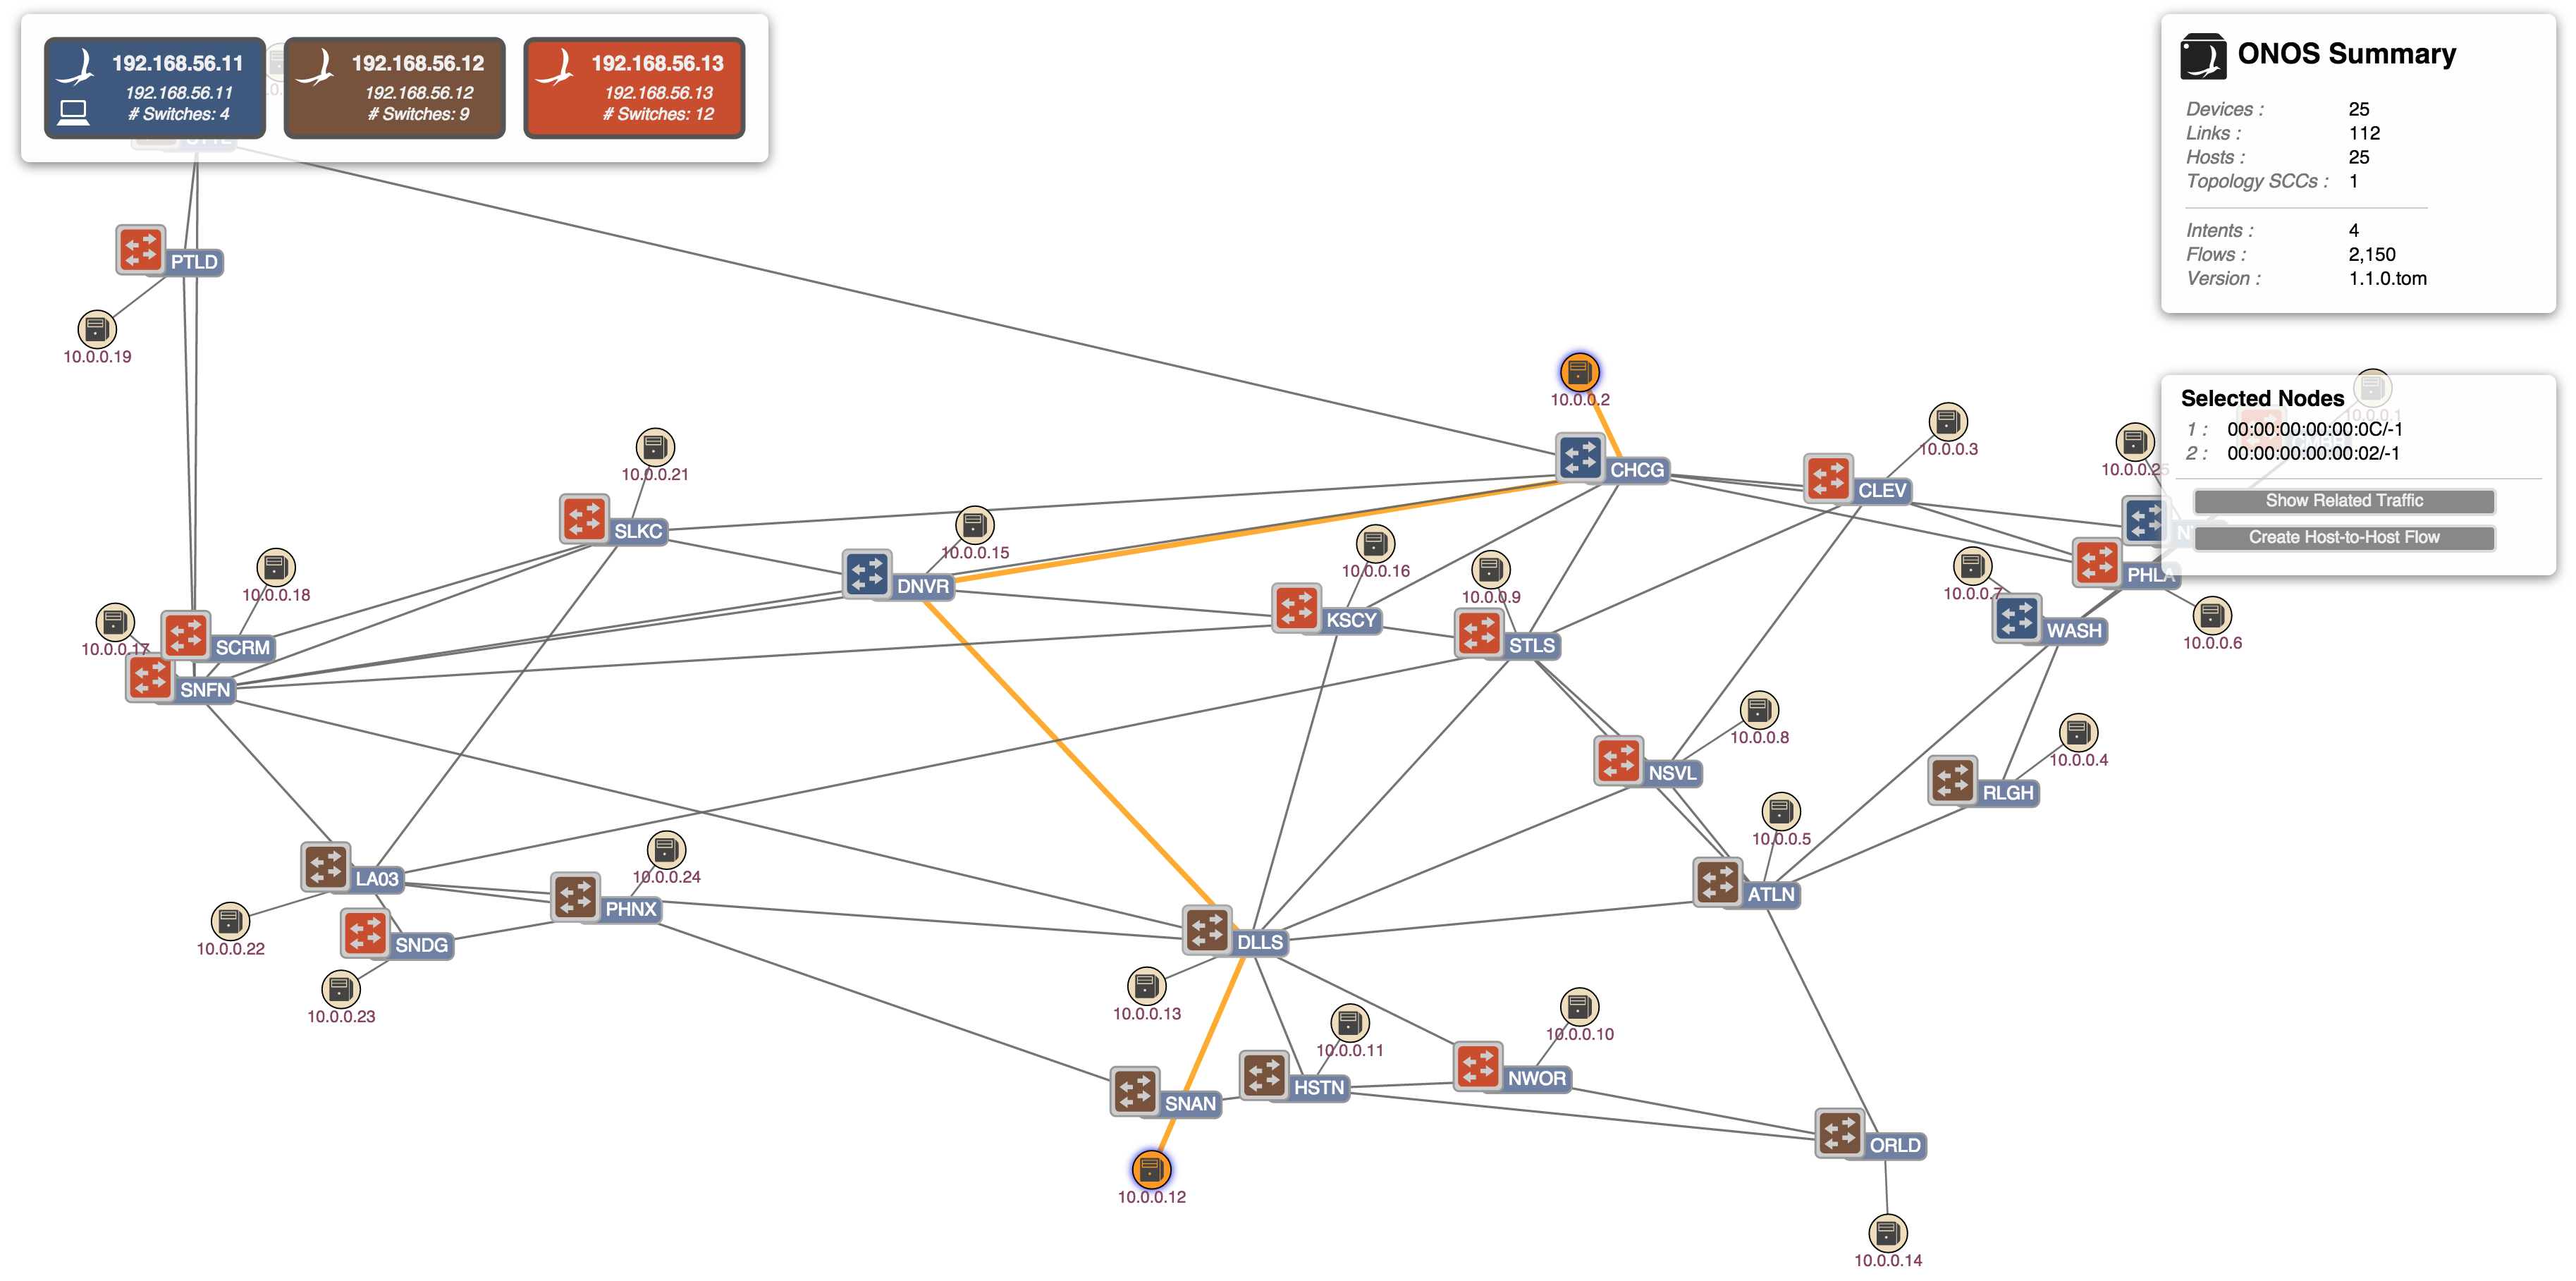
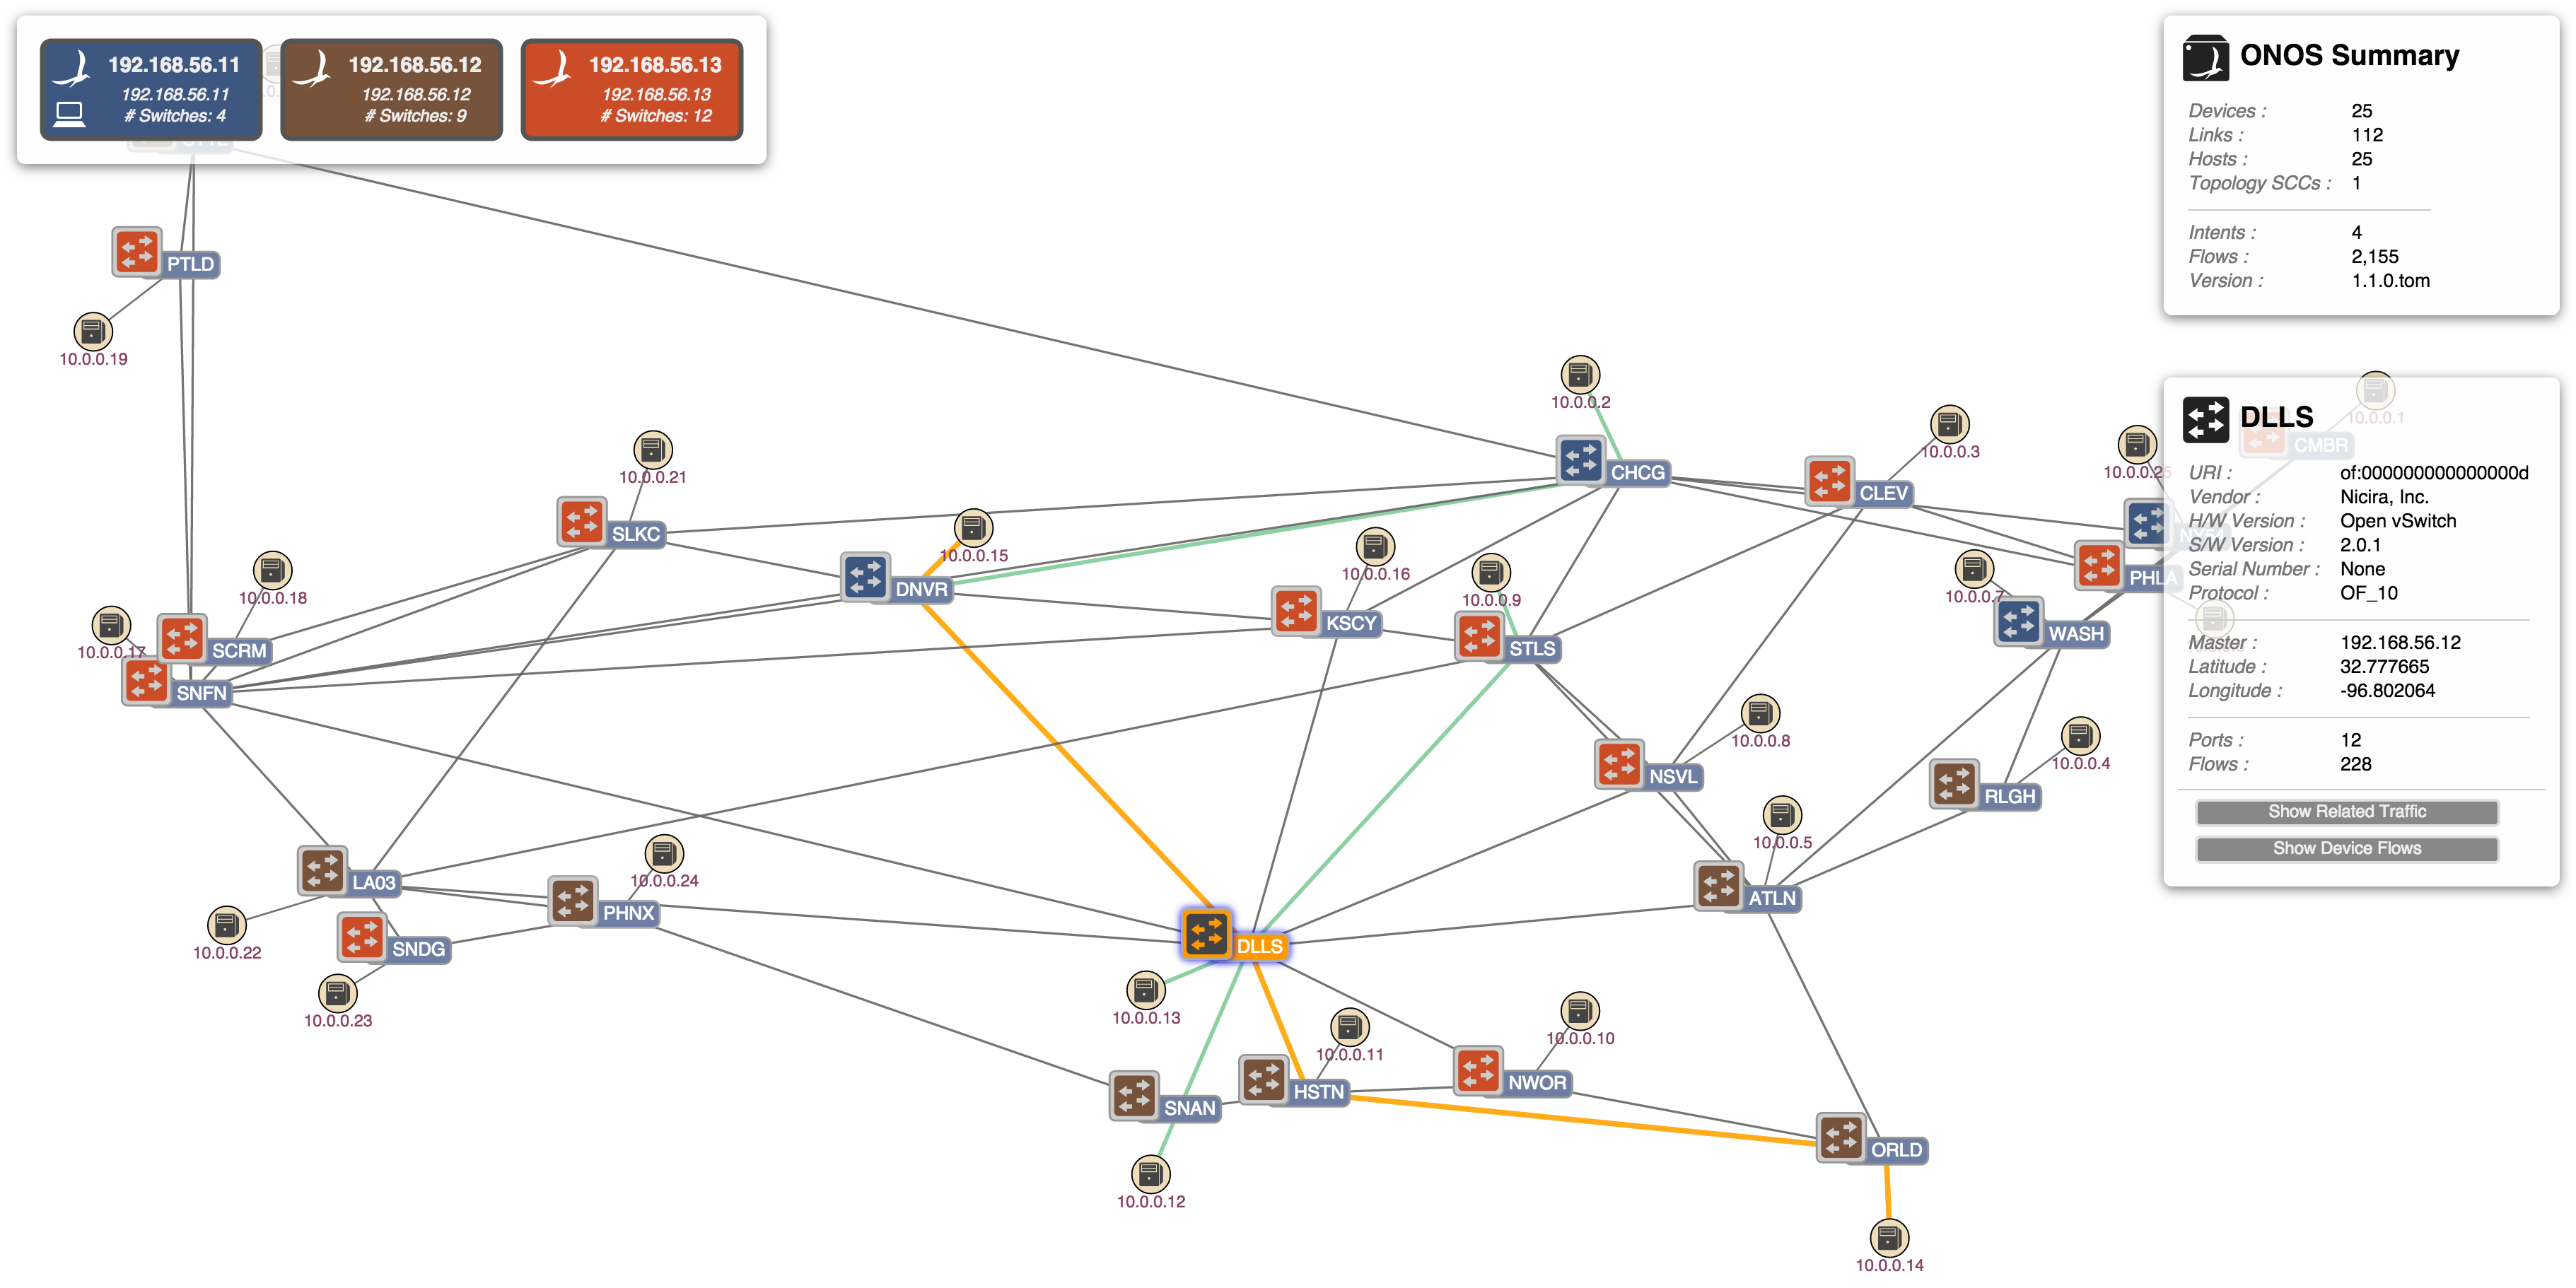
Clearing the selection, then selecting the Dallas device and pressing the 'V' key, we can see the related intents:
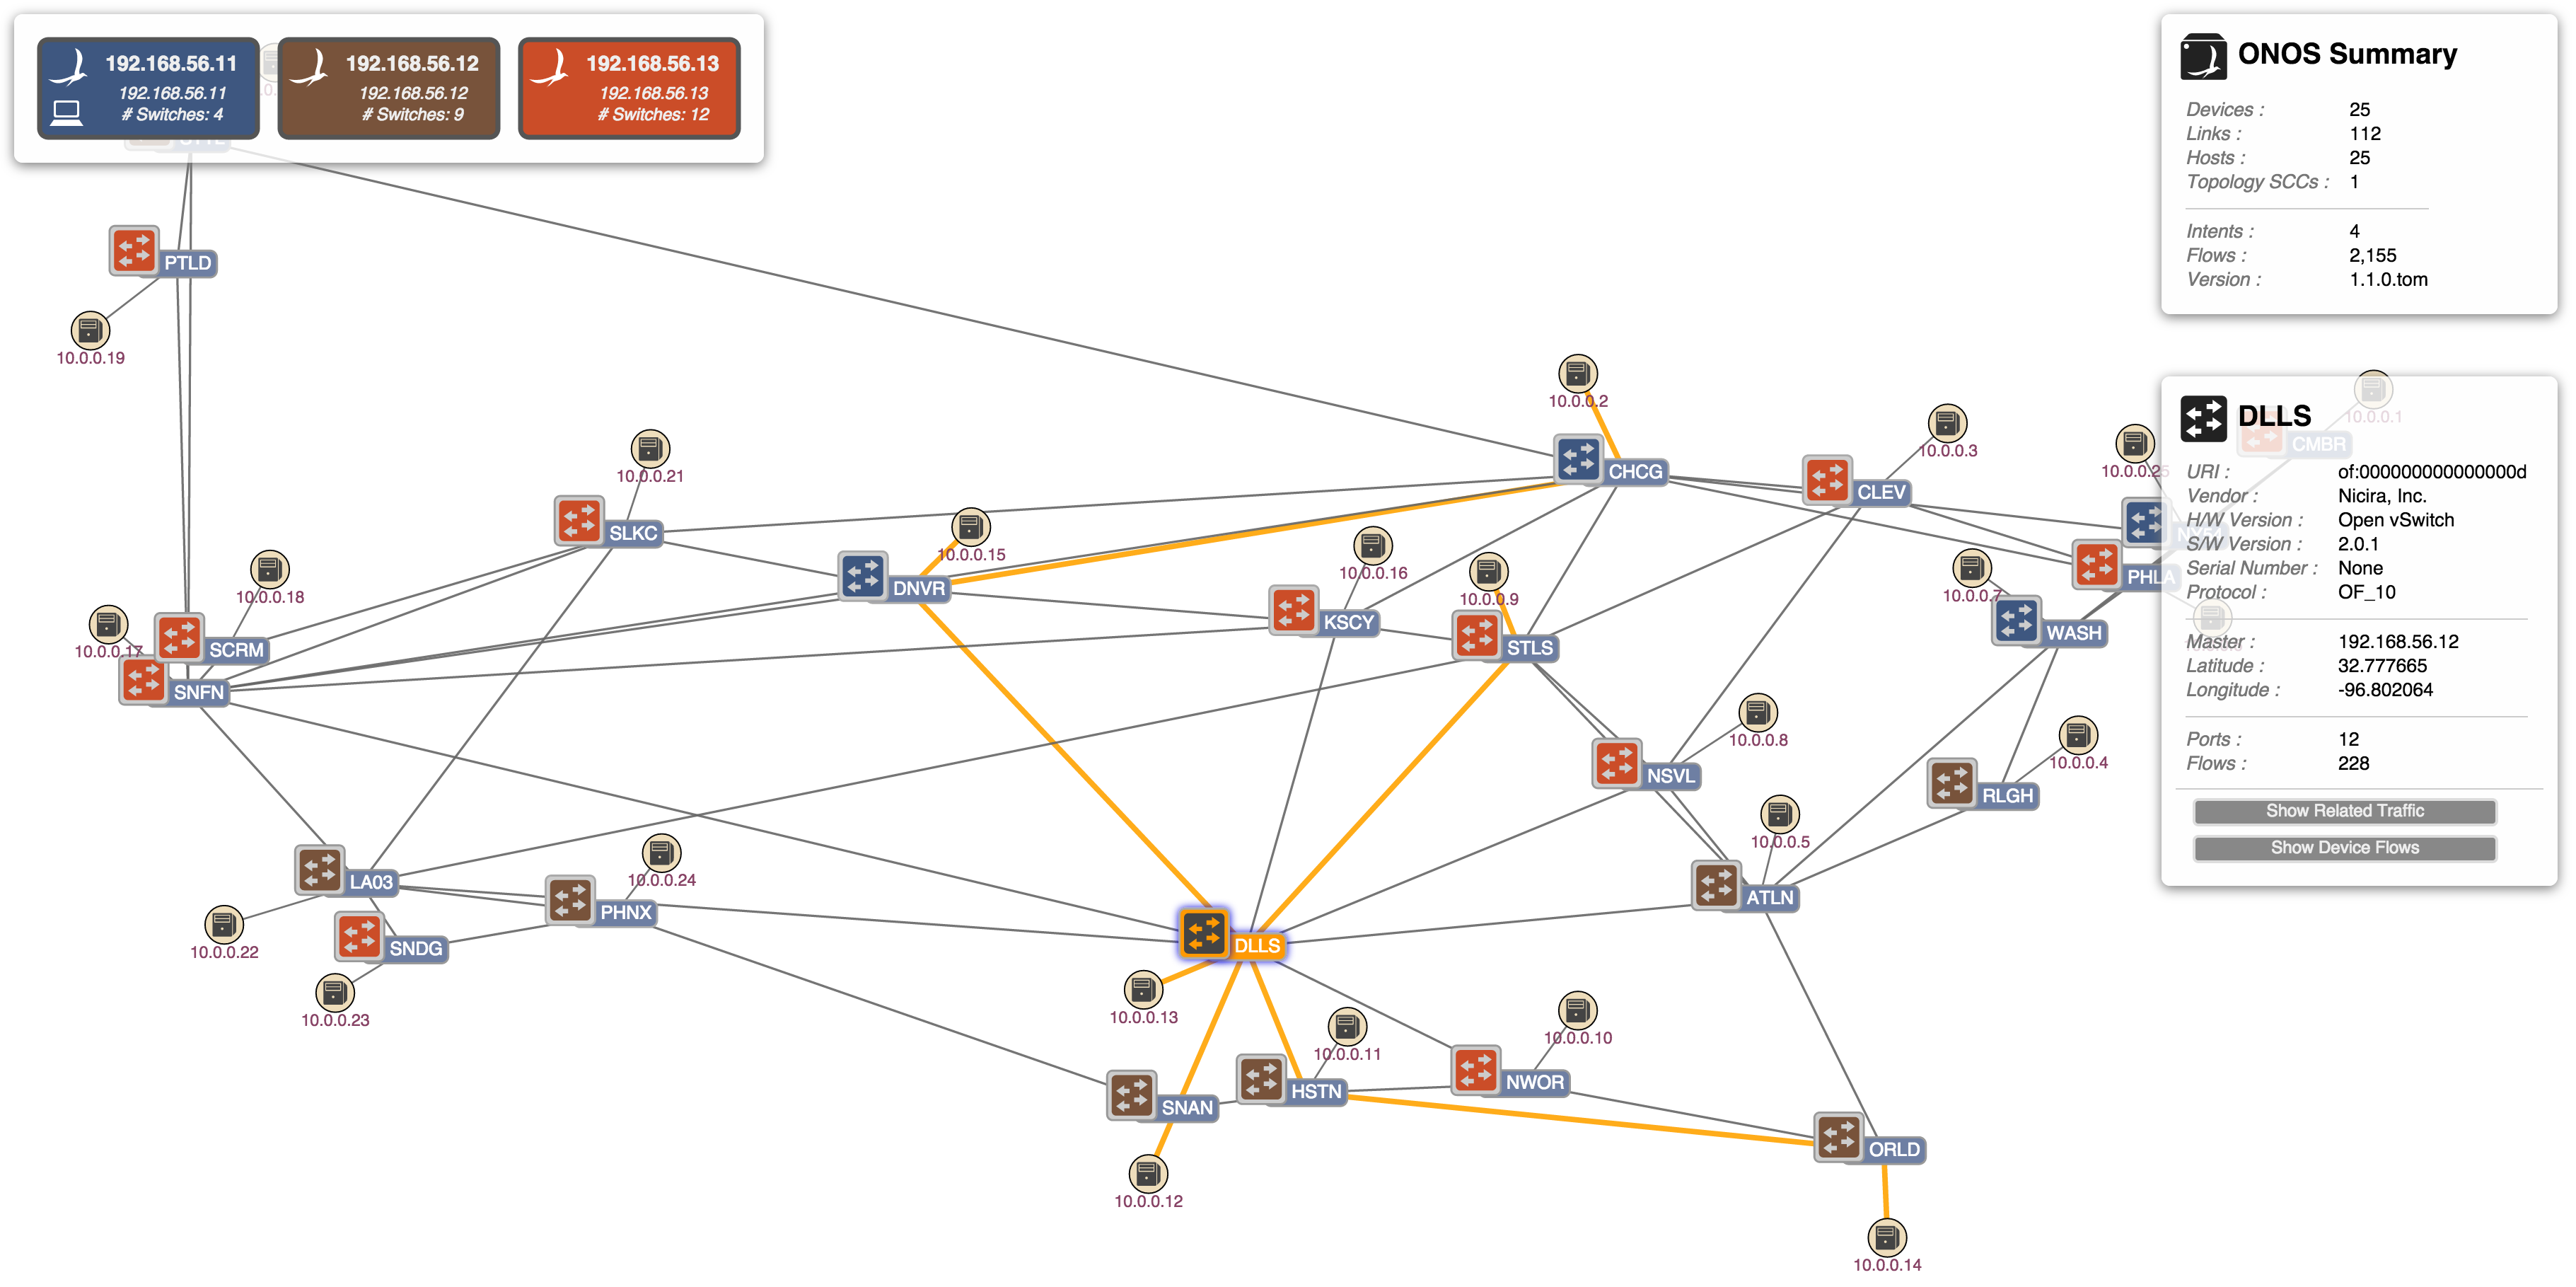
Now, by repeatedly pressing the Right-Arrow key (for next-related-intent) or Left-Arrow key (for previous-related-intent), we can step through the intents one at a time. Notice how one intent will be highlighted in orange (the primary selection) and all the other (related) intents are highlighted in green (the secondary selection):
(1) Press '→' key
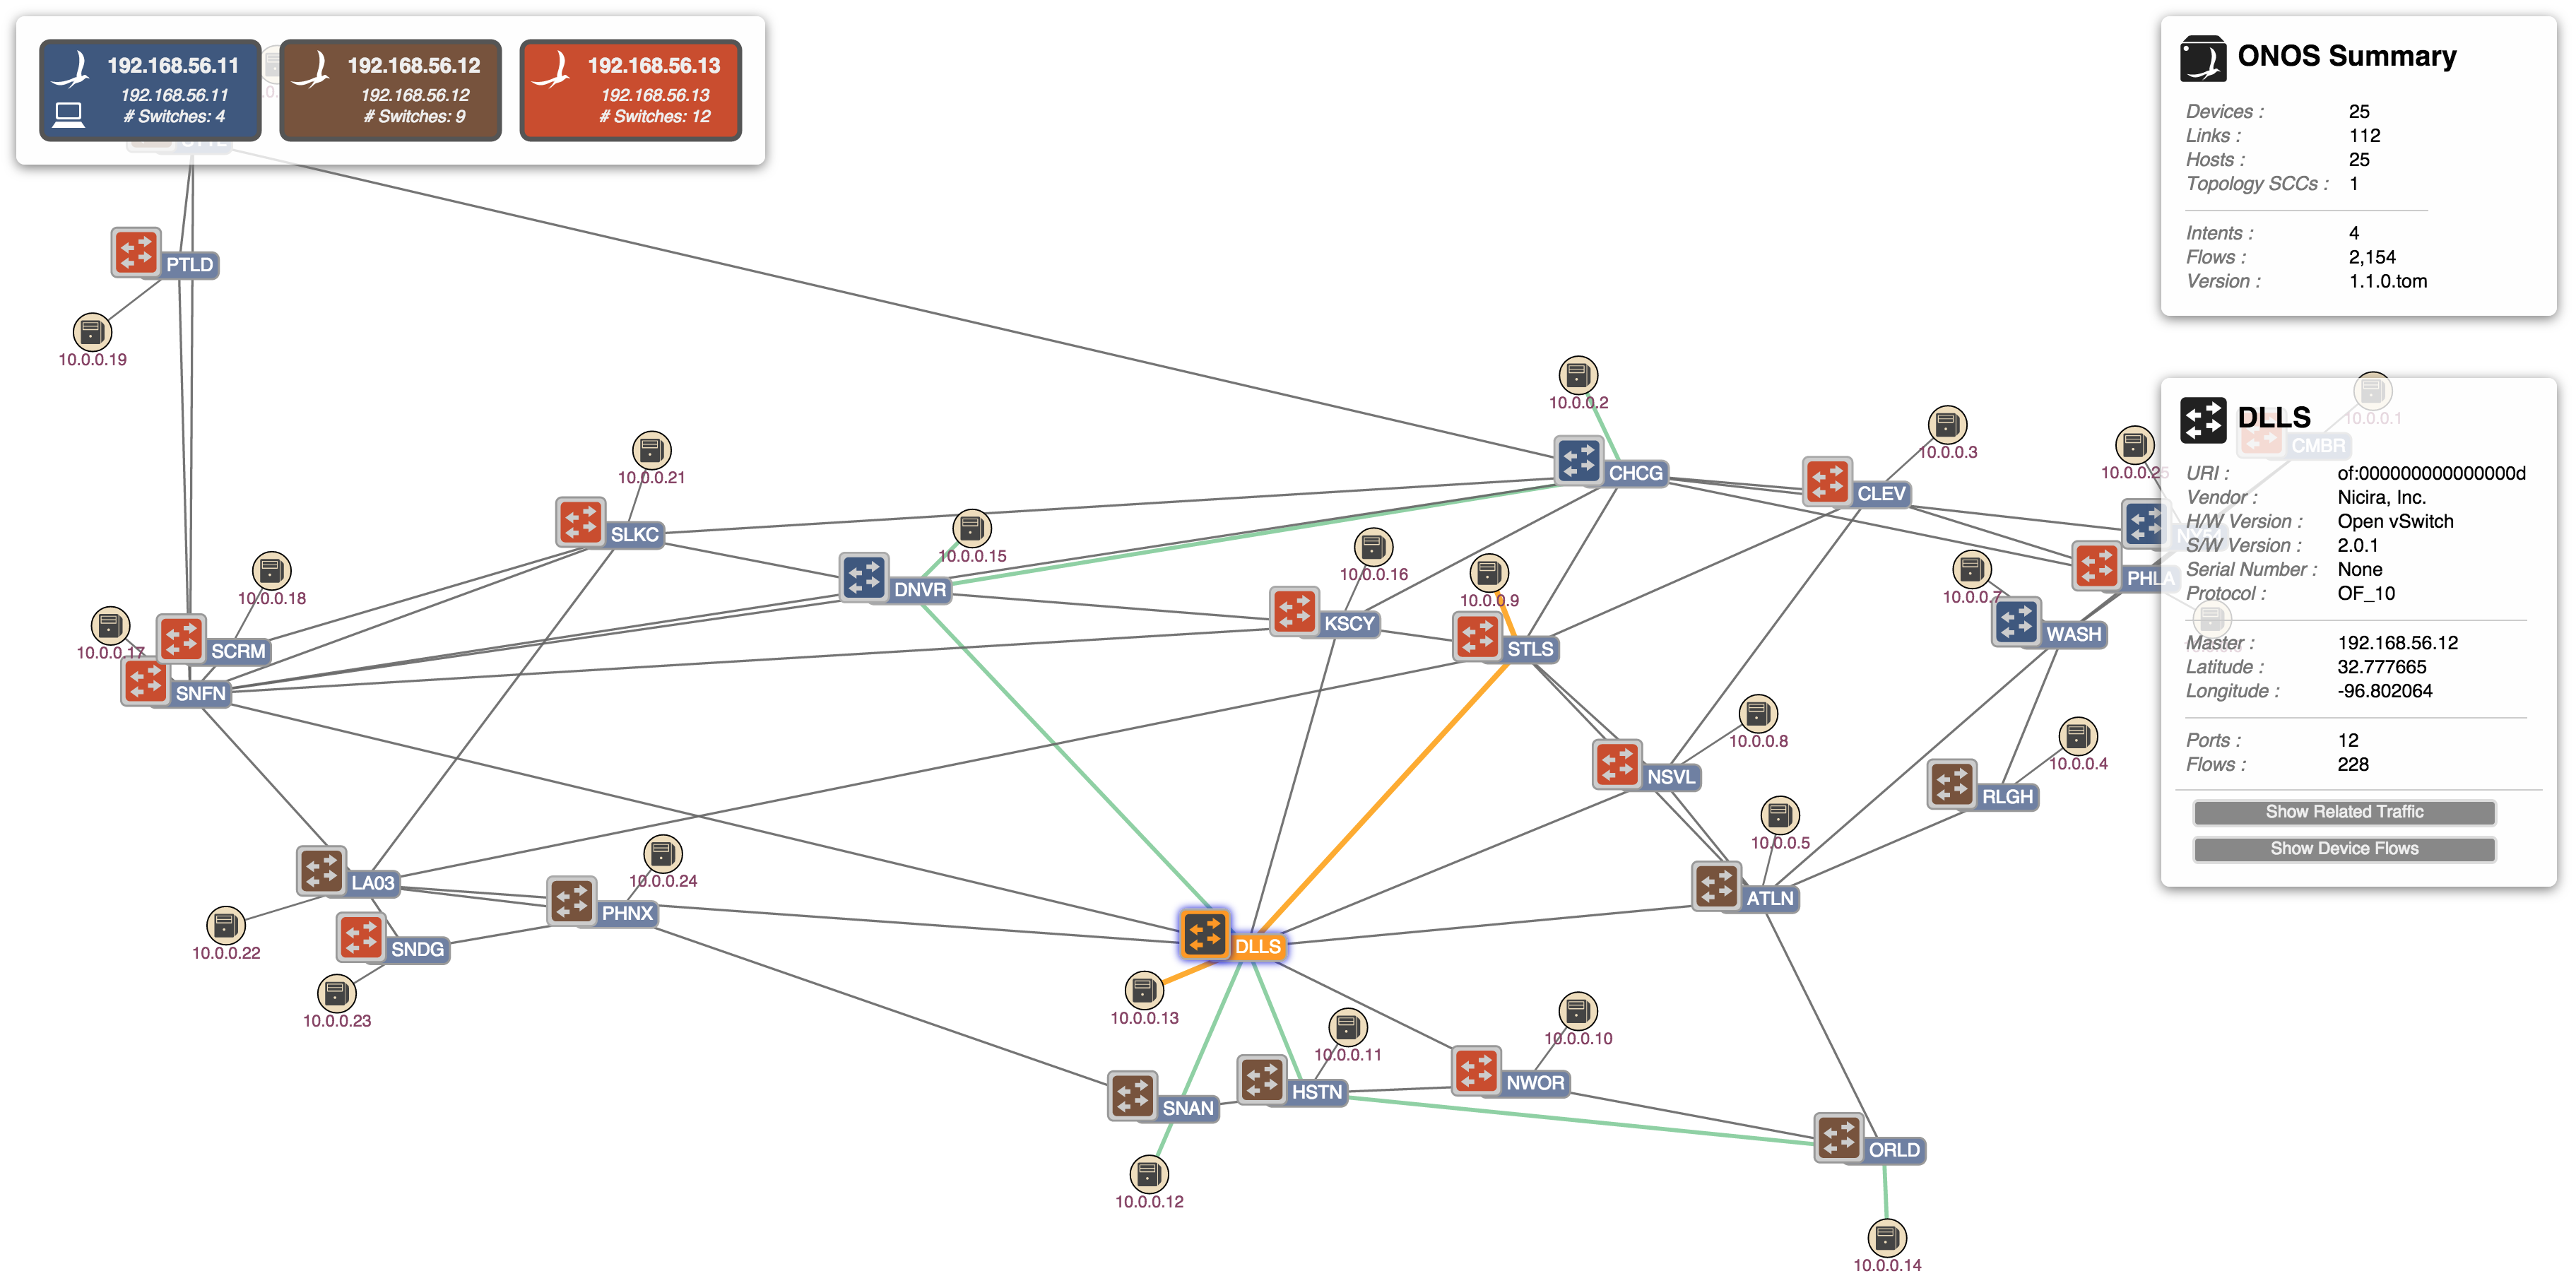
(2) Press '→' key
(3) Press '→' key
ONOS Instance Failover
The GUI is designed to detect when the Cluster Instance to which it is connected fails, and to seamlessly "failover" to an alternate cluster member.
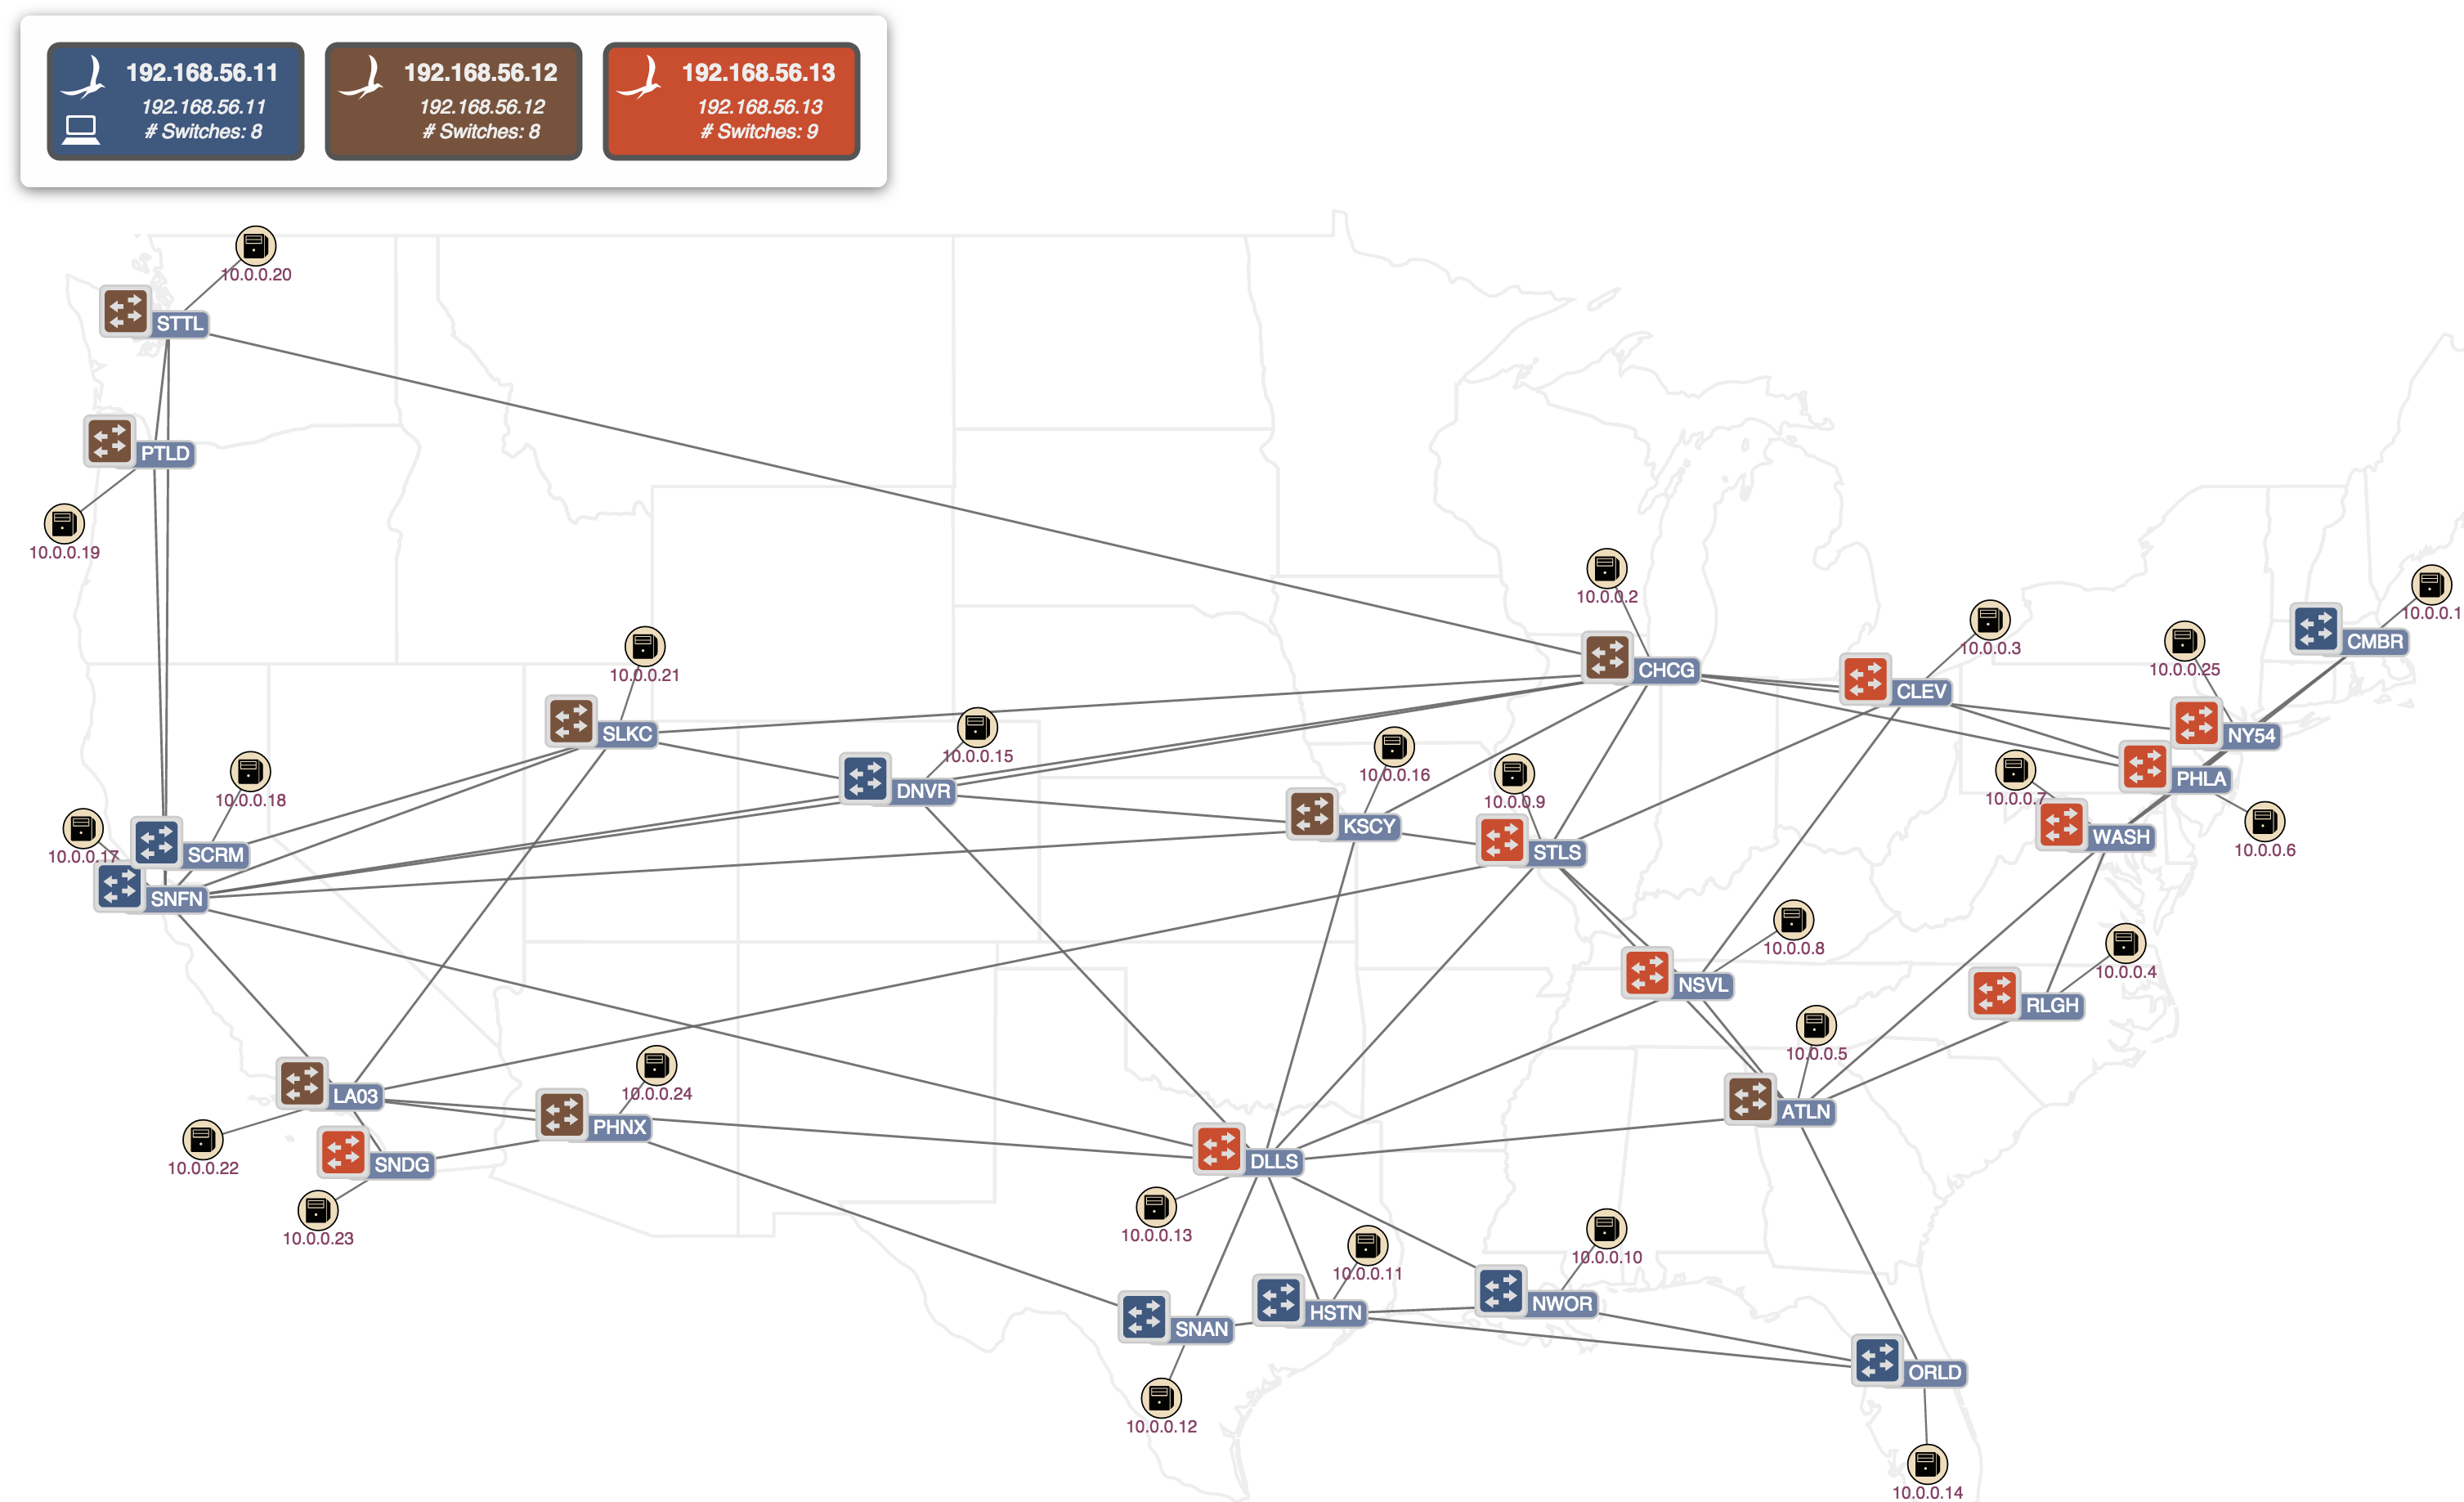
(1) Note the three instances, each master of a number of switches (8, 8, and 9, respectively). Note also that the UI is attached to the first instance, as indicated by the icon:
(2) Here, the first instance has failed and the UI has switched over to the second instance. Note also that the remaining two instances have picked up mastership of the switches (now, 9, and 16 respectively):
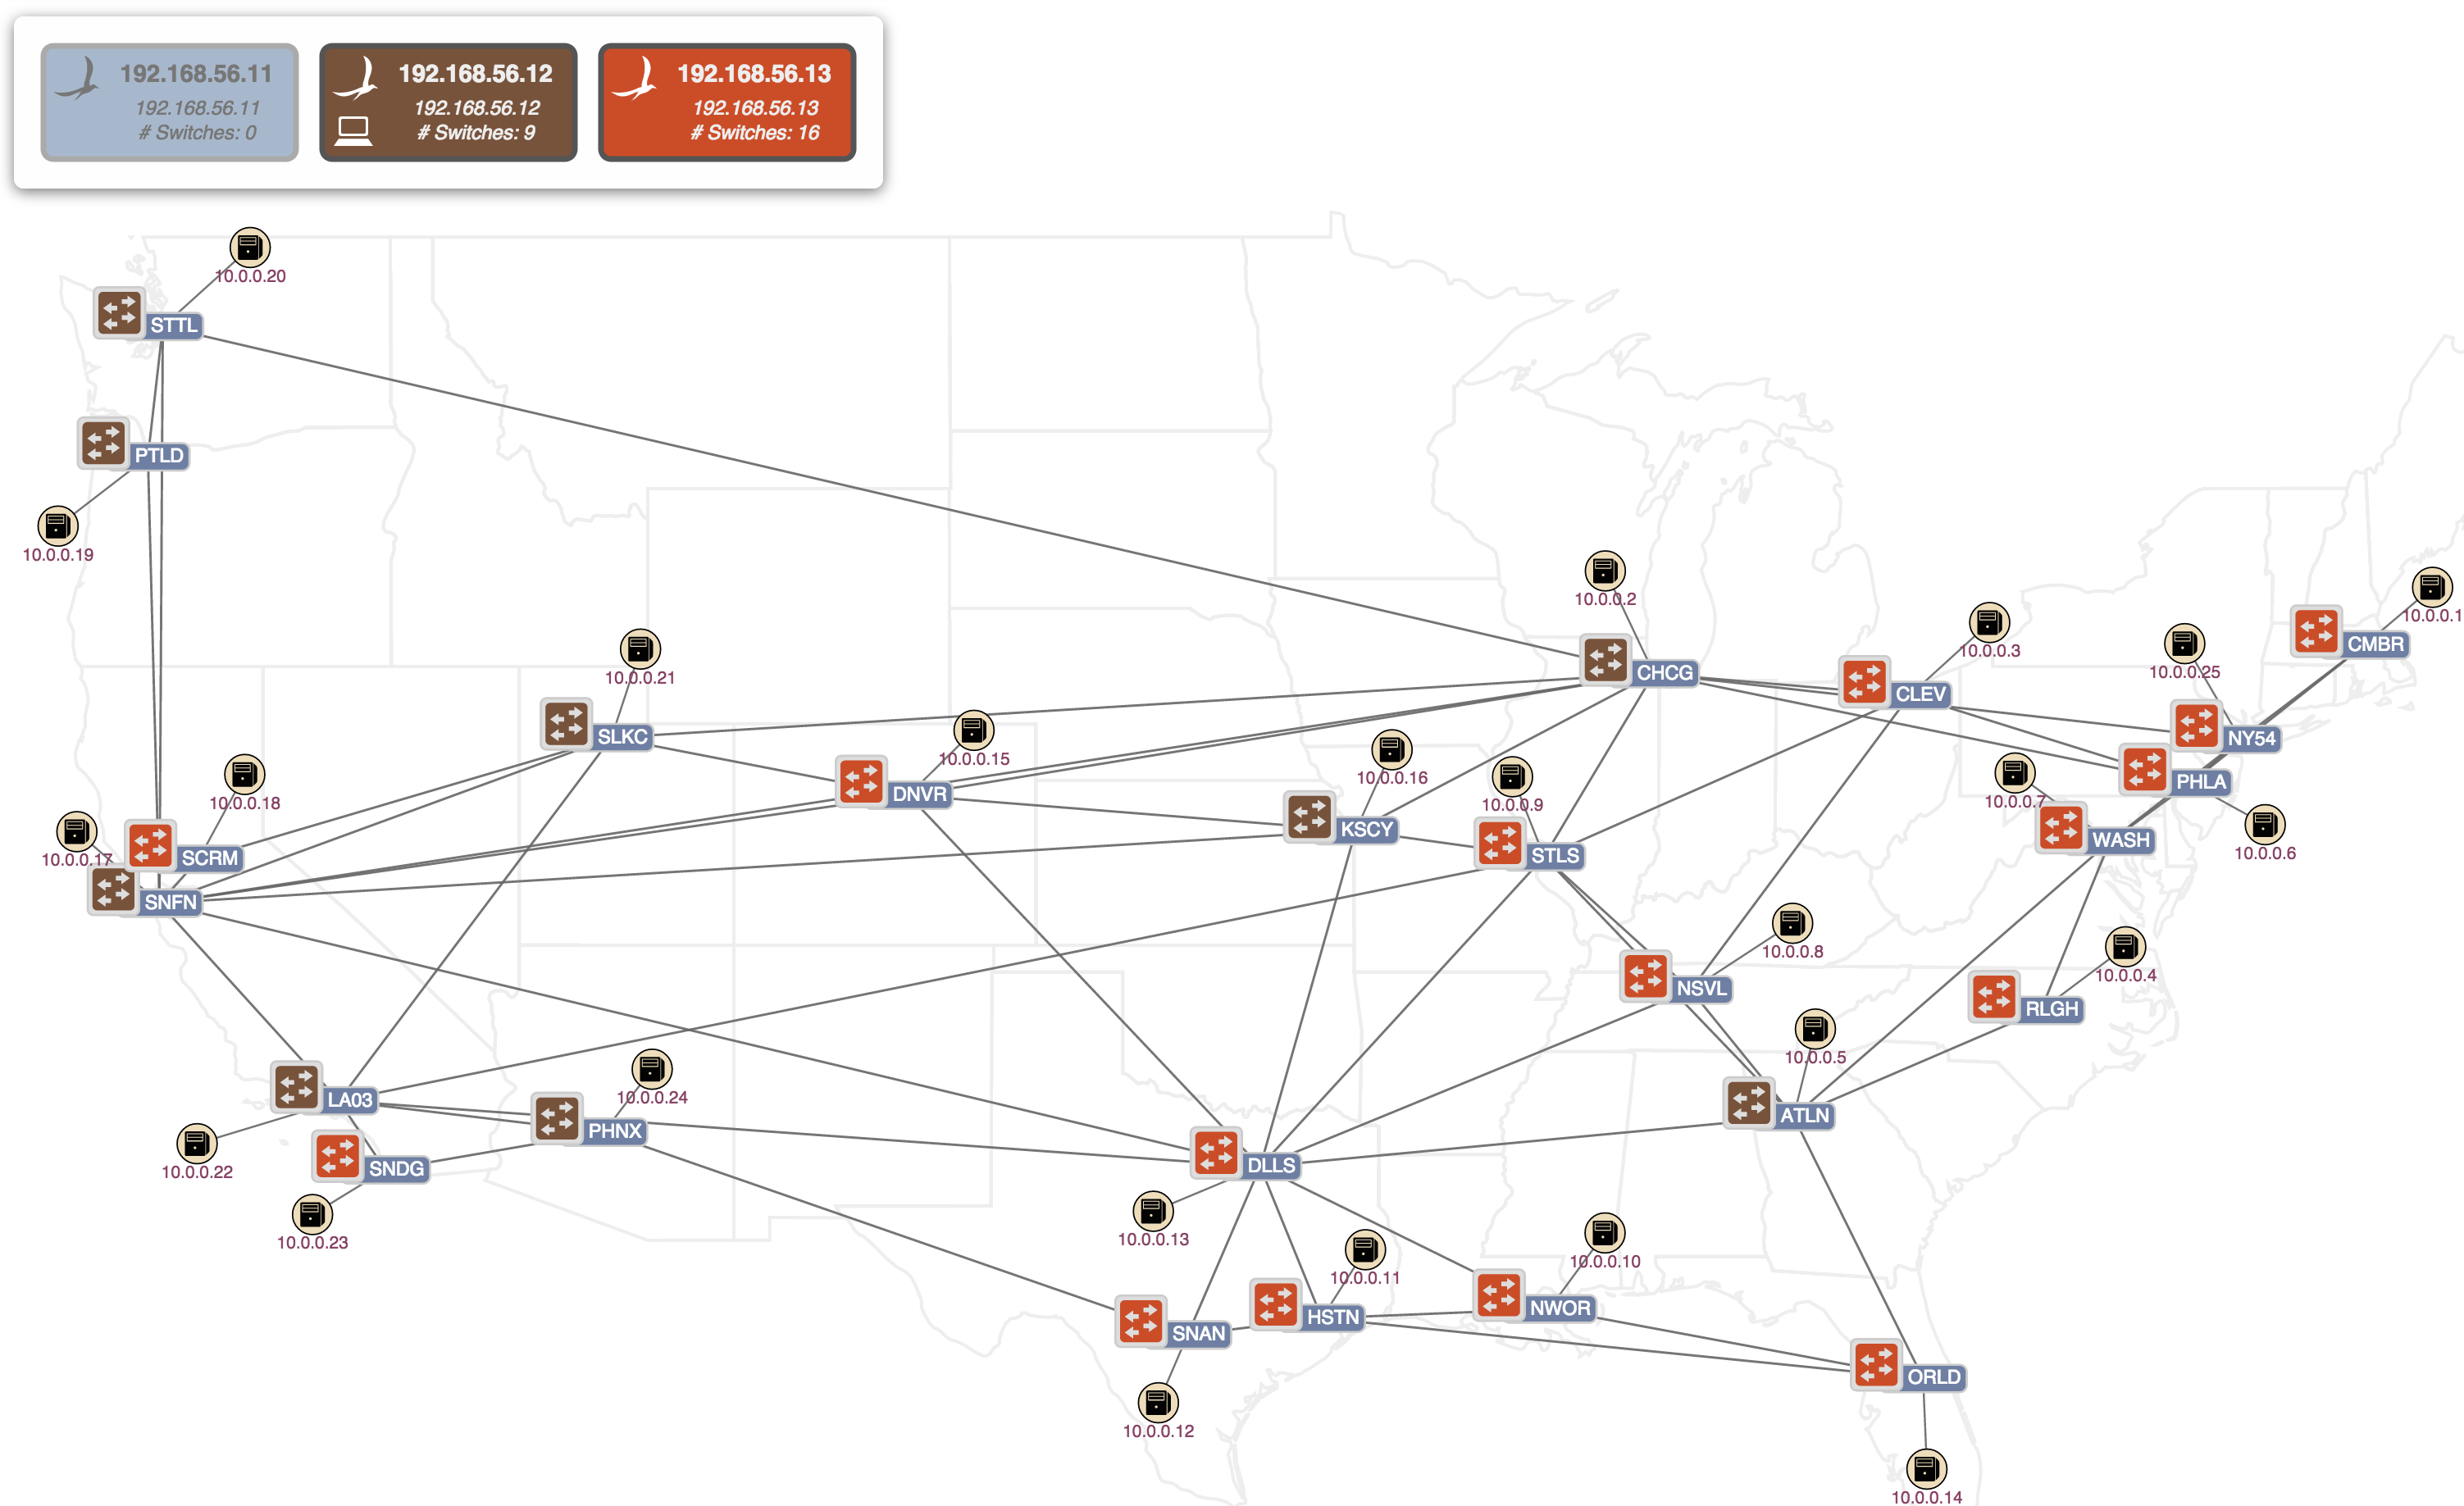
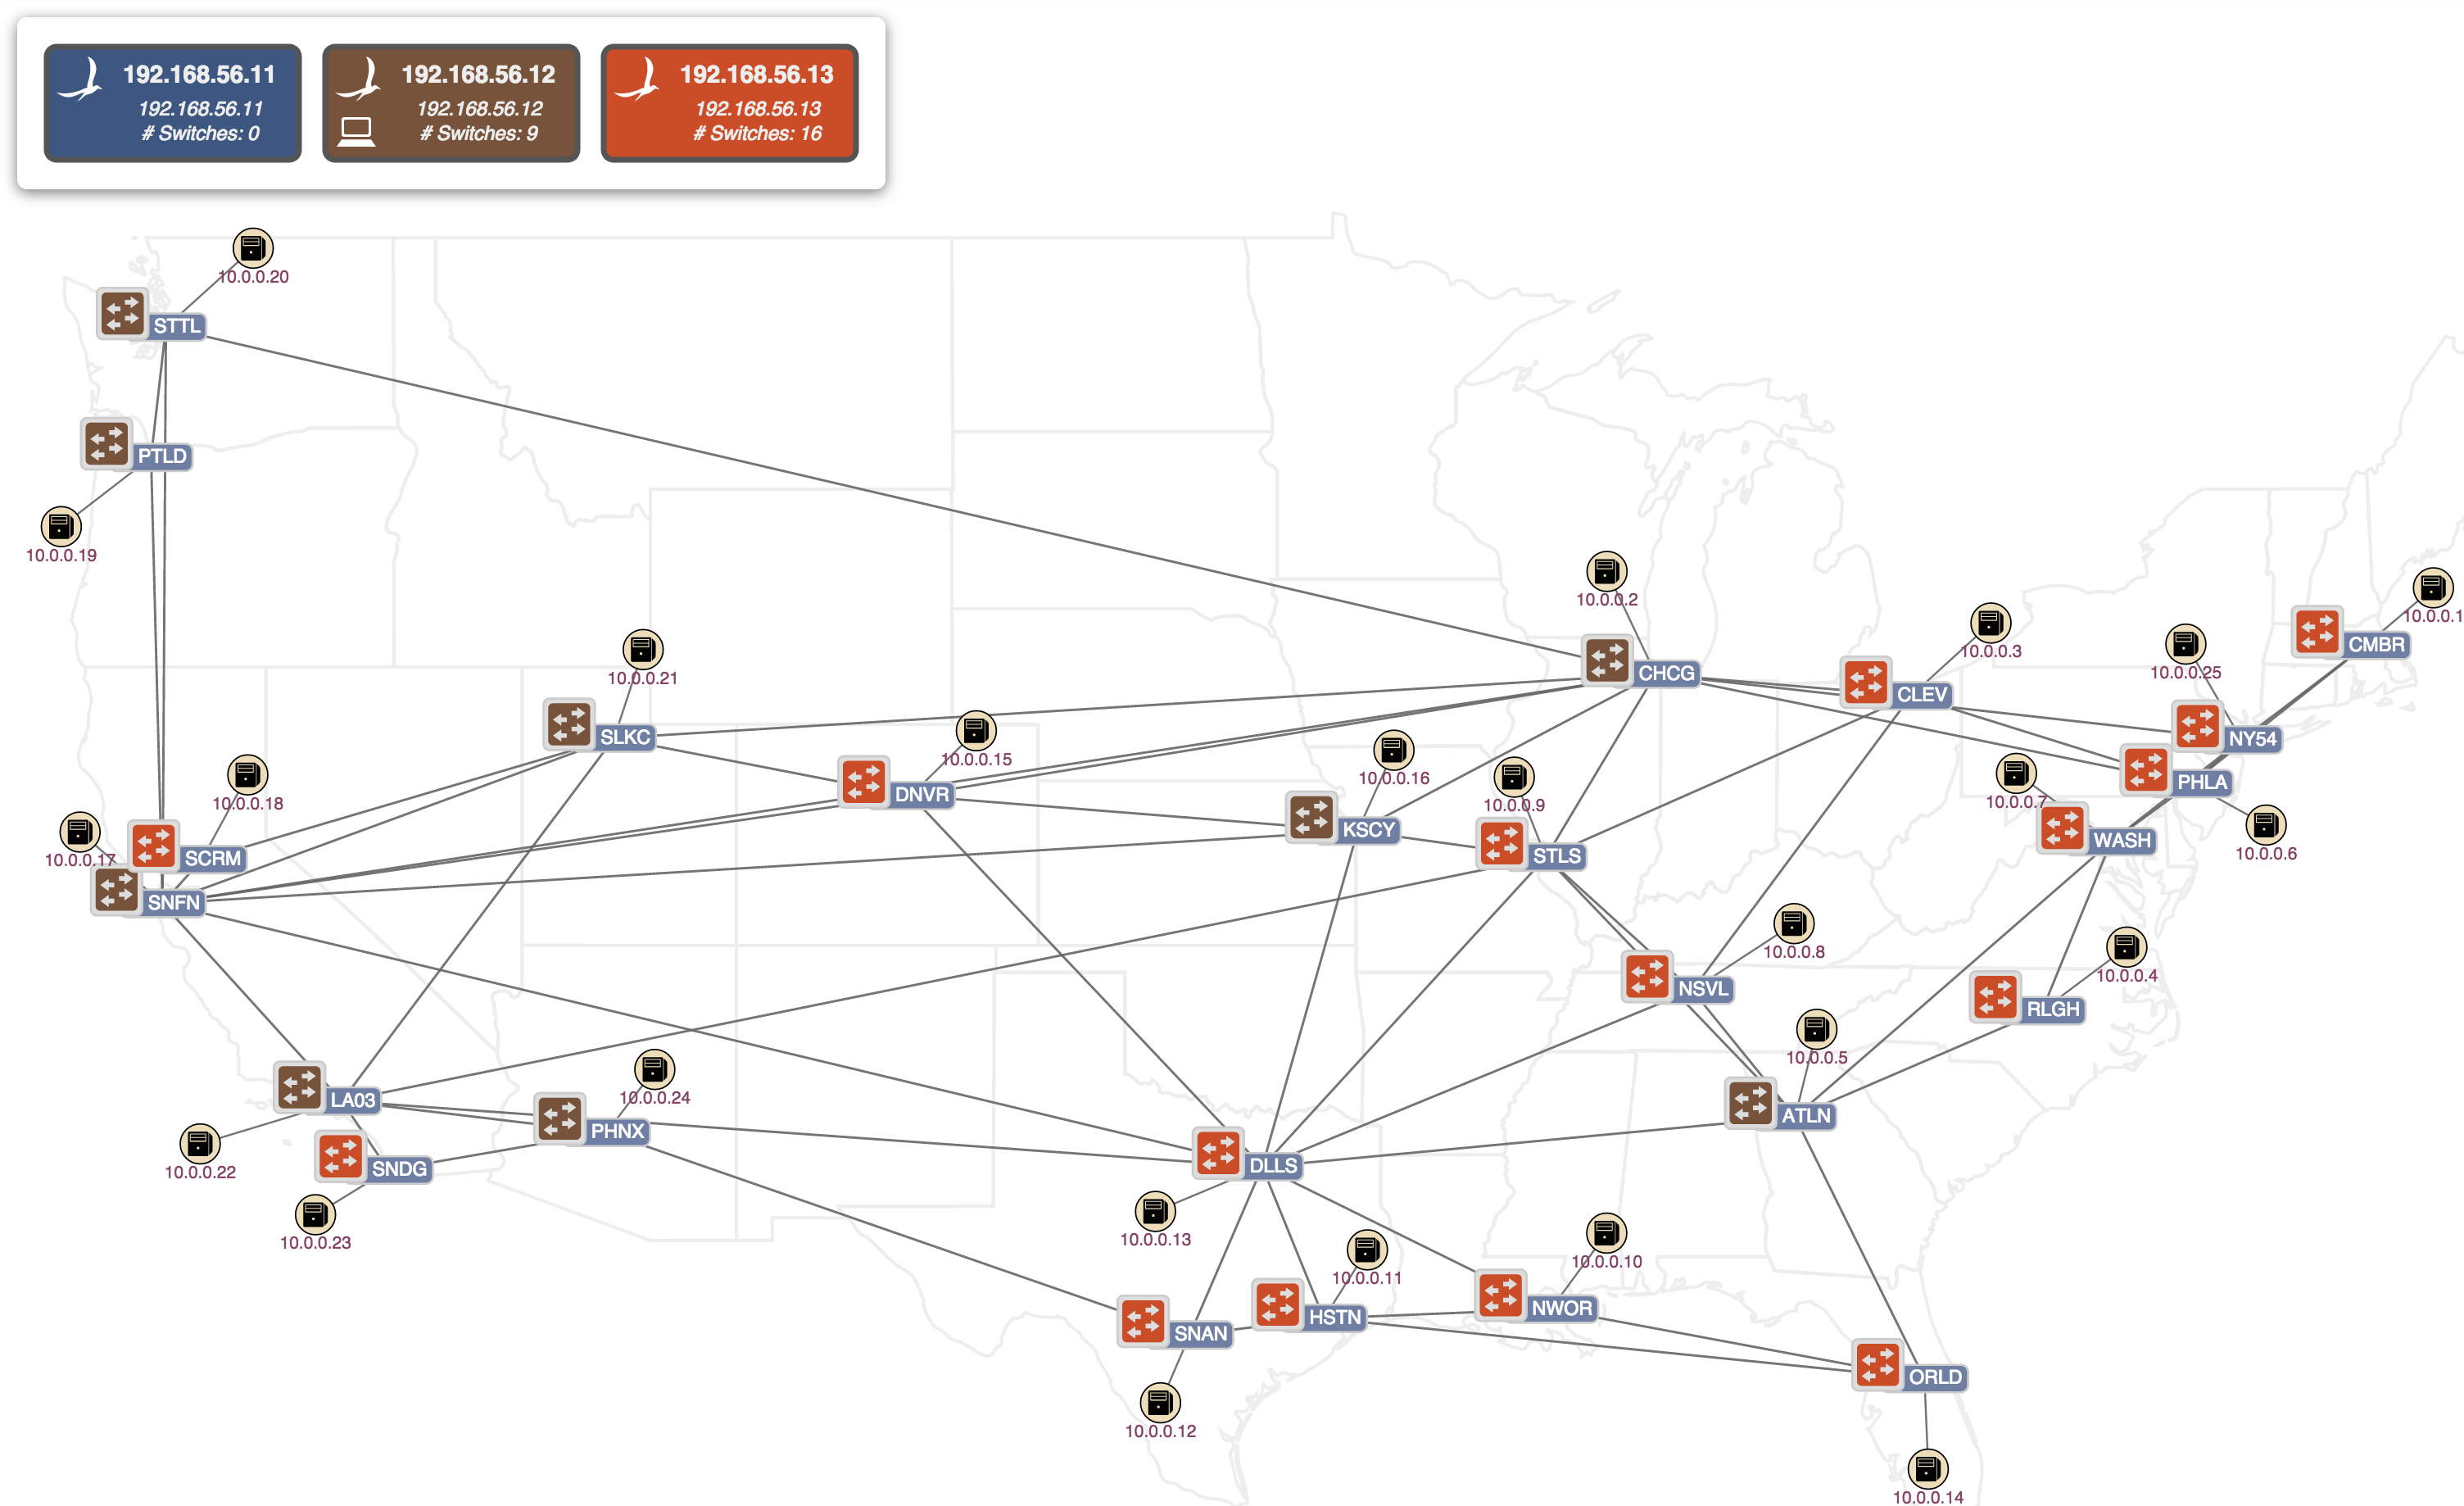
(3) When the first instance recovers it comes back online, but note how the UI remains attached to the second instance, and also that there is no automatic re-balancing of switch mastership. (now, 0, 9, and 16, respectively):
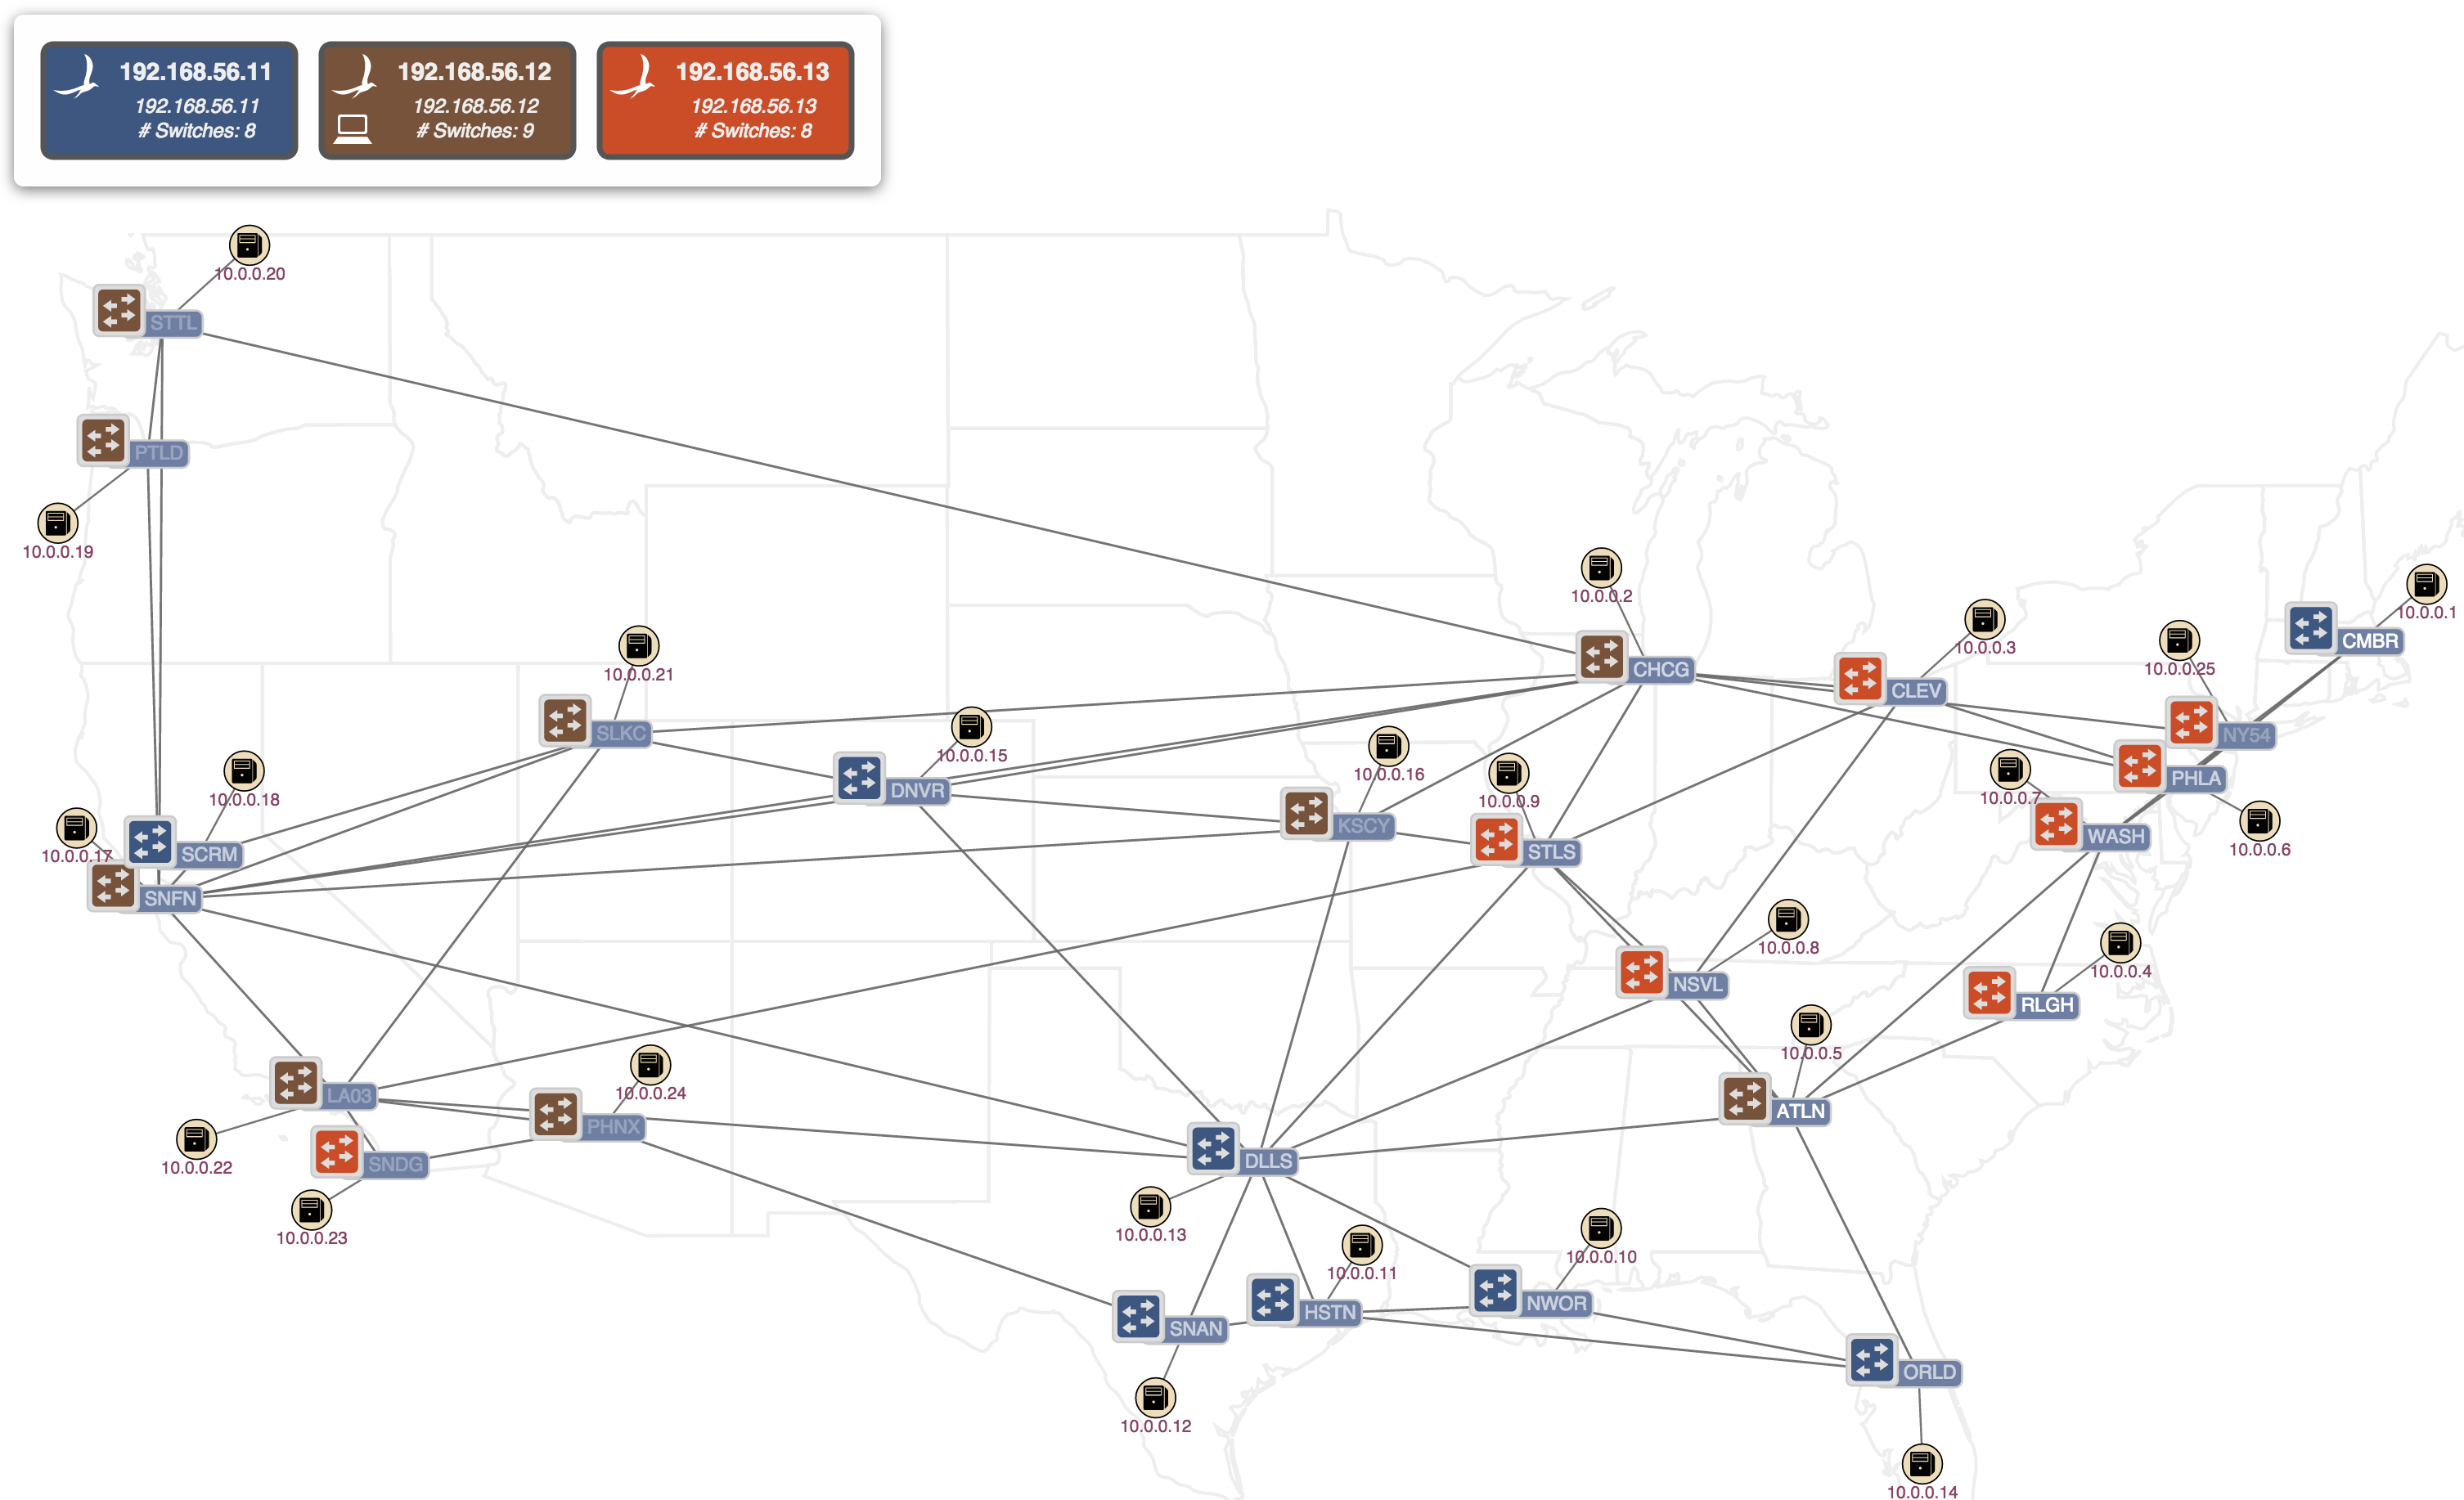
(4) Pressing the 'E' key sends a command to the server to "Equalize" the mastership roles across the cluster. Note now how the switches have been rebalanced, (now 8, 9, and 8, respectively):
Miscellaneous Controls
The remaining keystrokes are:
- M - Toggle offline device visibility
- Normally, offline devices are shown as grayed-out icons. This can be toggled to where offline devices are hidden instead.
- B - Toggle background image
- The map of the Continental US can be toggled off and on.
- X - Lock / unlock node positions
- The default is to allow click-and-drag to move nodes (devices & hosts) on the display.
- Z - Toggle oblique view (Experimental)
- This mode will show a "sideways" view of the network, separating packet-layer nodes from optical-layer nodes.
- As noted, this mode is currently experimental.