Due to a ransomware attack, the wiki was reverted to a July 2022 version. . We apologize for the lack of a more recent valid backup.
Reference:
- for Test Plan see: Test Plan - Perf & Scale-out;
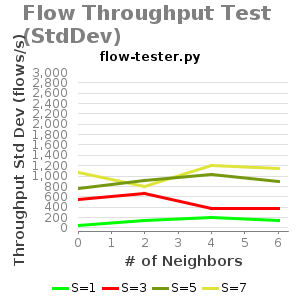
- ONLabTest script - https://github.com/opennetworkinglab/ONLabTest:flowTP1g.
System Environment:
- Server: Dual XeonE5-2670 v2 2.5GHz; 64GB DDR3; 512GB SSD
- 1Gbps NIC
- JAVA_OPTS="${JAVA_OPTS:--Xms8G -Xmx8G}"
- (no flow rules backup)
"Constant-Load" Test Conditions:
- F = 122500 - total # of flows installed
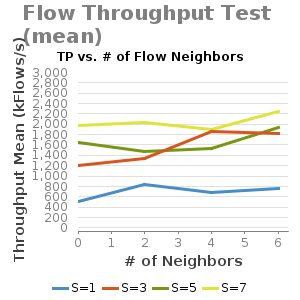
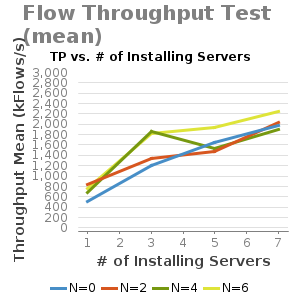
- N: # of neighboring ONOS's for flows to be installed from a server installing flows
- S: #servers installing flows
- SW = 35 - total # of switches (Null Devices) connected to ONOS cluster evenly distributed to active ONOS nodes
- FL: # flows to be installed on each switch
Command: python3 $ONOS_ROOT/tools/tests/bin/flow-tester.py -f FL -n N -s servers
Iterations on each test:20 (after 4 warm-up runs)
RC2 - Commit#: 6b30e1b5d89d829f673d20bec3ee4e2b072c02bc
Jenkins Run: #14 &15
Result:
Result Discussions:
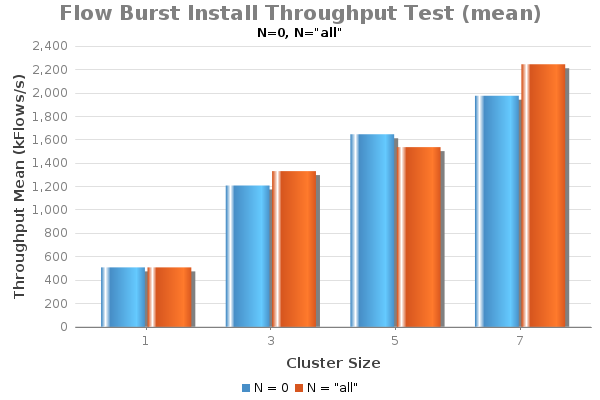
- When N = 0, all flow installation from all nodes are local, i.e. flows are for local switches. This are the cases when no EW communication is needed for flow operations;
- When N is "all", the neighbor setting N +1 is equal to the cluster size of the test. For instance, when testing with 3-node cluster, N=2. This are the cases when "maximum" of EW communication is needed for each node generating flows.
- As the result shows, flow installation throughput performance increases with cluster size.
Appendix:
Throughput Plots against various of flow pattern scenarios: