Due to a ransomware attack, the wiki was reverted to a July 2022 version. . We apologize for the lack of a more recent valid backup.
Reference:
- for Test Plan see: Test Plan - Perf & Scale-out;
- ONLabTest script - https://github.com/opennetworkinglab/ONLabTest: TopoPerfNextBM
Test Setup:
- RC2 - commit 4964d3d768deb0a8b5773c84f47787db455ceaba
- Using OVS version 2.3.1/OF 1.3
- Bare-metal Servers: dual-Xeon E5-2670, 32GB DDR3 RAM, SSD, Cluster Network is 1Gbps
- JAVA_OPTS="${JAVA_OPTS:--Xms8G -Xmx8G}"
- "org.onosproject.net.topology.impl.DefaultTopologyProvider.cfg": maxEvents = 1; maxIdleMs = 0; maxBatchMs = 0
Test Procedure:
- switch event generate on ONOS1 by connecting one ovs switch to it by "ovs-vsctl set-controller";
- record open flow port status msg by tshark, device and graph event timestamps to calculate differences. In a multi-node test, the node with latest Graph event timestamp is used.
- test is run in multiple iterations to obtain statistical results
- a number of warm-up runs are used before taking test.
Result:
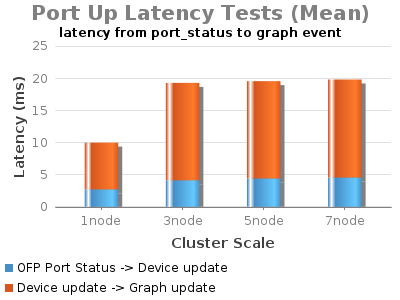
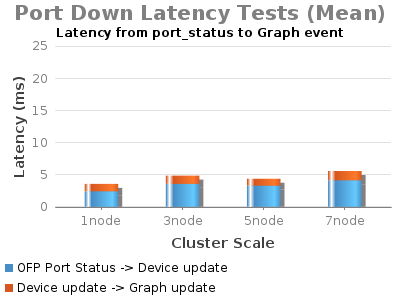
Result Discussions:
- "Port up" latency is higher than "Port down". This is largely due to additional ONOS operations in a port-up event. In a port-up event, additional PacketIn/Out messages for link discovery are handled by ONOS, whereas in port-down event, there is no such additional operation.
- A typical port-up timing breakdowns for a 3-node cluster test are the following:
- OFP of_port_status -> complete Packet In/Out for link discovery: 11ms
- OFP of_port_status -> Device Event: 5~11ms
- complete Packet In/Out for link discovery -> Link Event: 5~6ms
- Link Event -> Graph Event: 1~2ms