Due to a ransomware attack, the wiki was reverted to a July 2022 version. . We apologize for the lack of a more recent valid backup.
Reference:
- for Test Plan see: Test Plan - Perf & Scale-out;
- ONLabTest script - https://github.com/opennetworkinglab/ONLabTest: TopoPerfNextBM
Test Setup:
- RC2 - commit 4964d3d768deb0a8b5773c84f47787db455ceaba
- Using OVS version 2.3.1/OF 1.3
- Bare-metal Servers: dual-Xeon E5-2670, 32GB DDR3 RAM, SSD, Cluster Network is 1Gbps
- JAVA_OPTS="${JAVA_OPTS:--Xms8G -Xmx8G}"
- "org.onosproject.net.topology.impl.DefaultTopologyProvider.cfg": maxEvents = 1; maxIdleMs = 0; maxBatchMs = 0
Test Procedure:
- switch event generate on ONOS1 by connecting ovs switch to it;
- record tshark (tcp syn-ack) and graph event timestamp to calculate differences. In a multi-node test, the node with latest Graph event timestamp is used.
- test is run in multiple iterations ("device-remove" is used to remove device from store between runs) to obtain statistical results
- a number of warm-up runs are used before taking test.
Result:
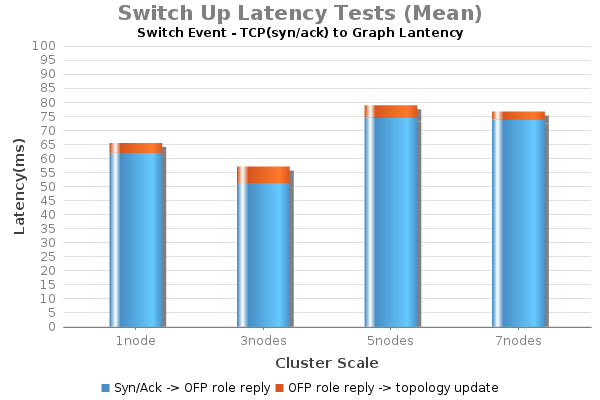
Result Discussions:
- Since TCP syn-ack -> OFP role_reply are related to Openflow msg exchange between OVS and ONOS, we can see that the ONOS core processing timing is the lesser portion of the total end-to-end switch up timing. The end-to-end latency stdev is in the range of 8~10ms.
- Wireshark to further dissect timing reveals that most of the time spent before OFP role reply is between "of_features_request" and "of_feature_reply" - in the order of 40~60ms. Therefore, the largest latency contributor is OVS switch response time. A further breakdown of a typical timing can be found in the following example (TCP syn -> OFP role reply = 58.1ms):
- TCP syn -> OFP Hello (from ovs): 0.3ms
- OFP Hello (from ovs) -> OFP of_features_request: 2.6ms
- OFP of_features_request -> OFP of_features_reply: 47.0ms
- OFP of_feature_reply -> OFP role_request: 8.0ms
- OFP role_request -> OFP role_reply: 0.2ms