Due to a ransomware attack, the wiki was reverted to a July 2022 version. . We apologize for the lack of a more recent valid backup.
Overview
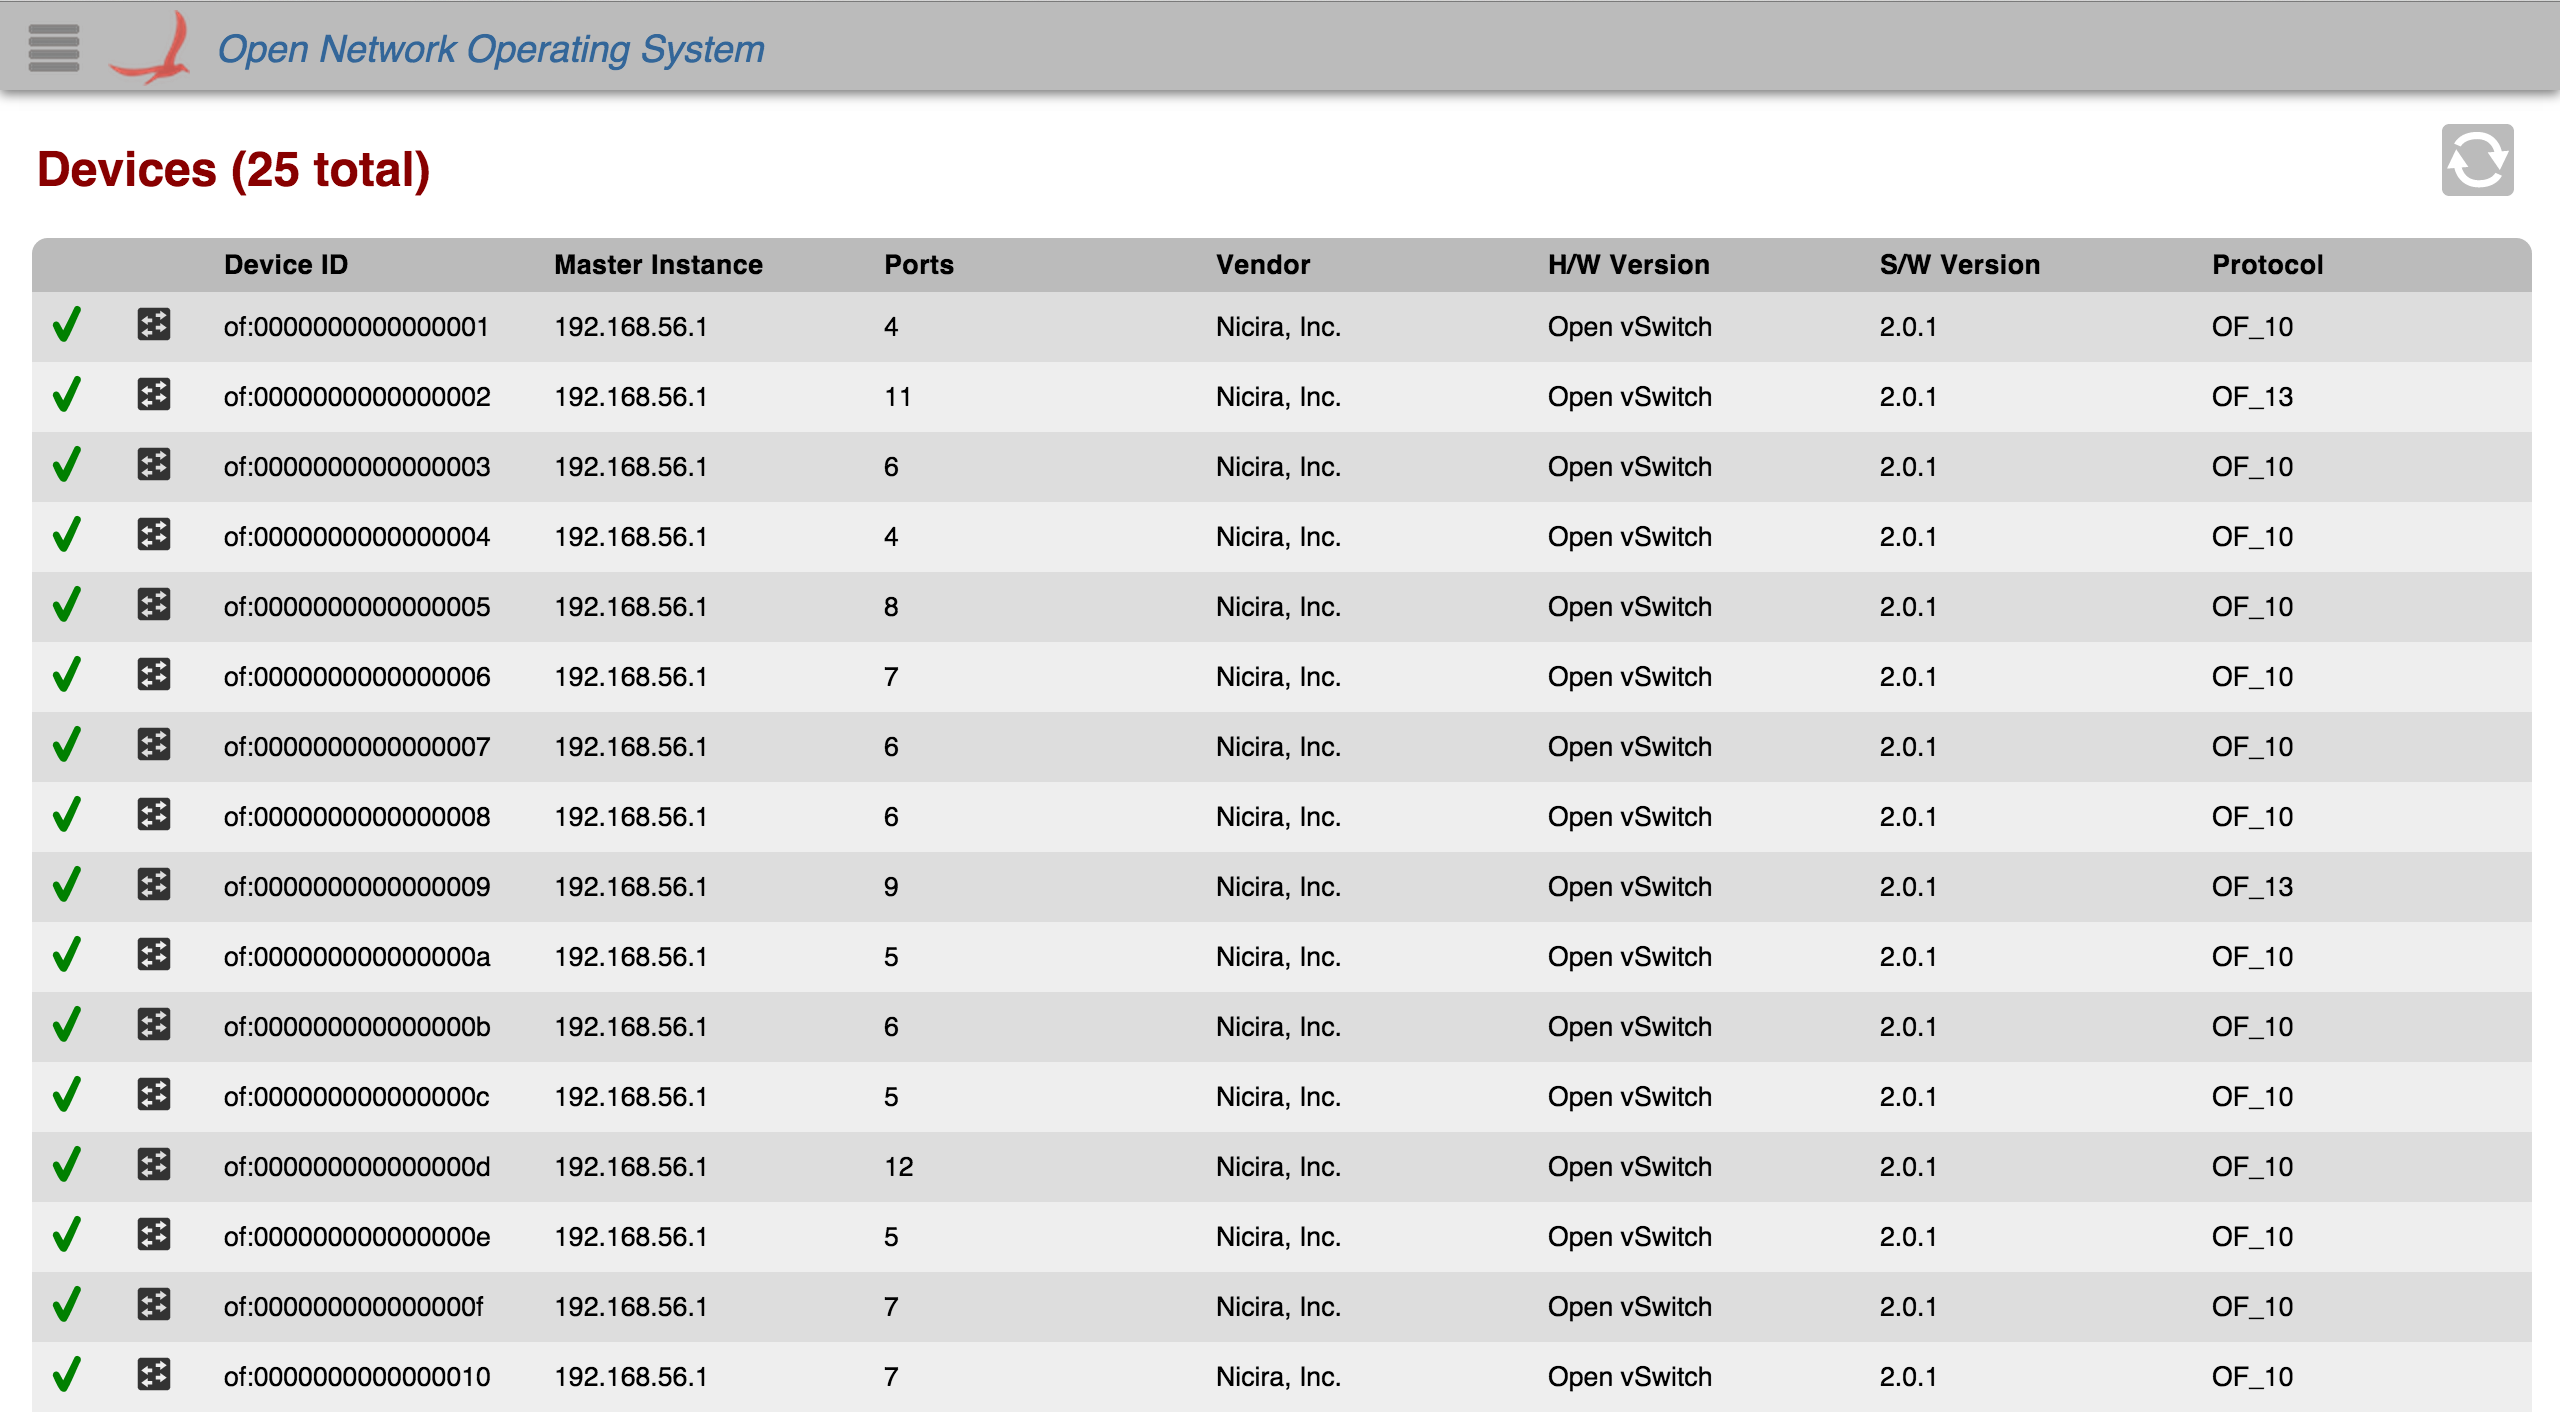
Tabular views show a tabular list of each type of information (devices, links, hosts, etc.) that is being viewed. An example of a tabular view (the Device View) is shown below:
You can make your own tabular view by following this tutorial.
View Header
At the top of every tabular view, there is a header that displays the network component you are viewing, with how many of that component is connected. In this example, we are seeing devices, and there are 25 of them in total.
Control Buttons
On the right, there is an area for control buttons. On all views, there is a refresh button.
 Refresh: All table views auto-refresh every two seconds. Click this button to toggle auto-refresh off and on again.
Table Body
The body of the table is scrollable so you can view all components on the network. Your browser's Find/Search capabilities work in the view, so if you want to quickly find something in the table you can use Cmd-F (Mac) or Ctrl-F (Windows).
Table Columns
The column headers for each section in the table are sortable. Once any header is clicked on, table will be sorted in ascending order and an icon will appear indicating the sorting direction.

If the same table header is clicked on again, then the sorting direction will reverse and the table will be sorted in descending order by that header. The icon will change to indicate the new sorting direction.

You can toggle between ascending and descending on most headers.
Table Rows
Each row in the table represents one of the components you are viewing.
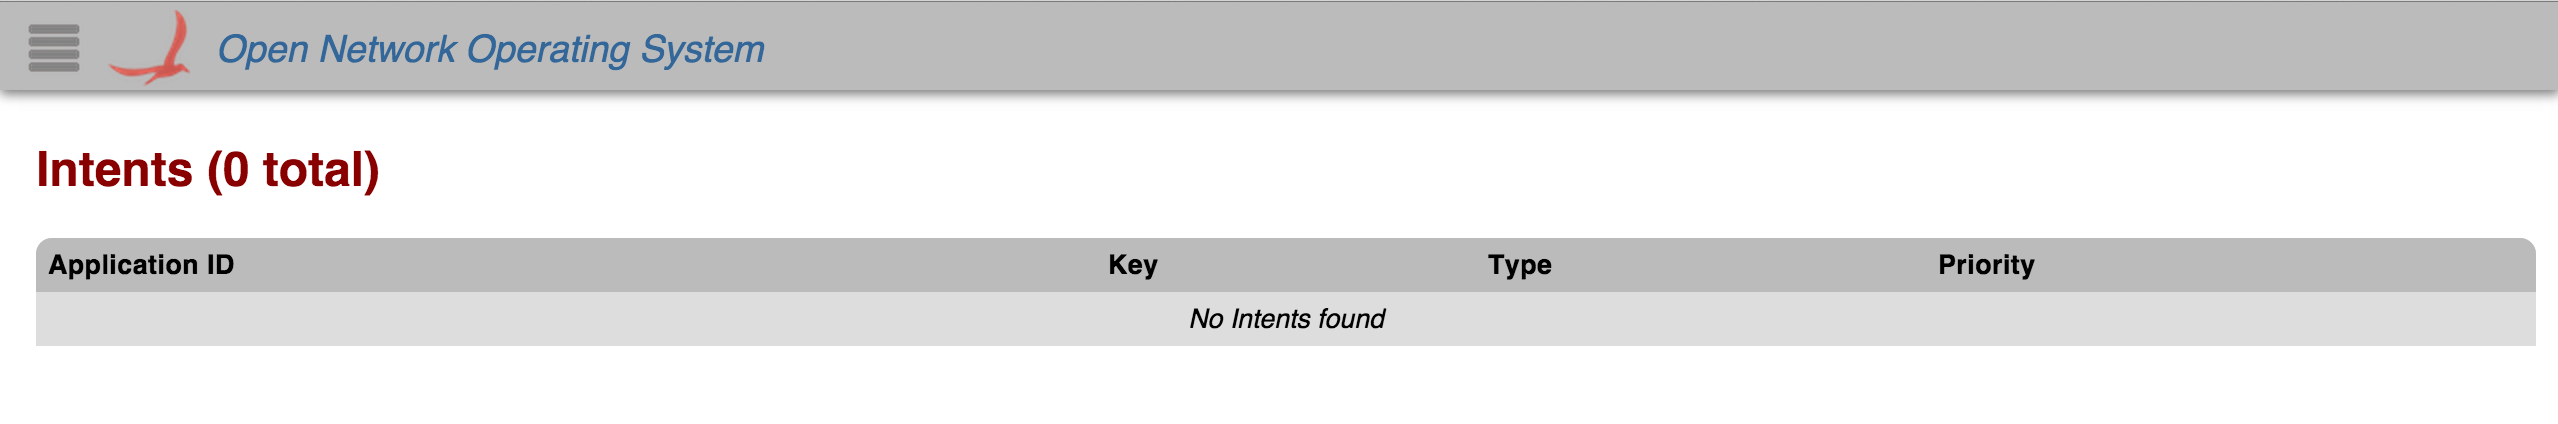
Empty Tables
If there are no components of that type, then an "empty table" will be displayed instead. The example below is the Intent View, with no intents: