Contributors
Name | Organization | |
Jian Li | POSTECH ON.Lab |
Overview
This application adds capability to report and retrieve metrics stored in MetricsService to/from InfluxDB.
InfluxDB is a distributed time-series database which is written in Go language. InfluxDB is optimized for storing time-series data, and it supports clustering.
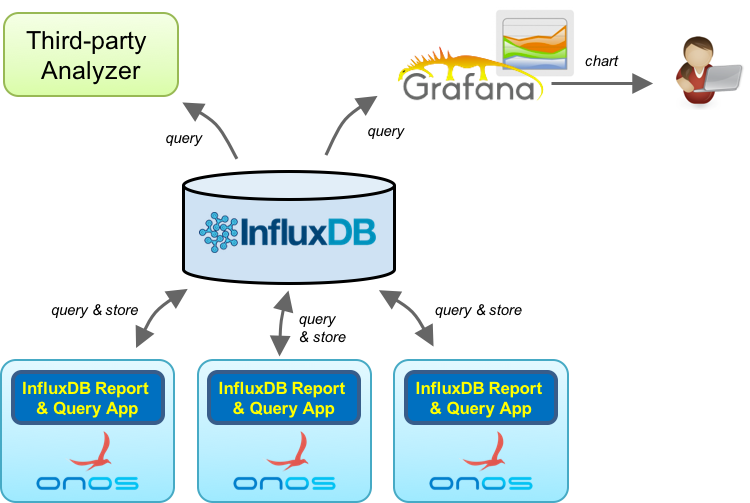
With this application, each of ONOS instance can periodically report various metrics data to influxDB, and developers/users can easily query global perform metrics from influxDB.
Since influxDB provides an interface to expose its data, network administrator can easily integrate influxDB with third-party visualization tools to realize dashboard.
By far, influxDB supports Grafana and Graphite visualization tool.
Architecture
InfluxDB Report and Query Application provides a way to reports all ONOS metrics data to InfluxDB periodically.
Moreover, the application provides the capability to query the metrics data from InfluxDB.
With this feature, a single ONOS instance can easily preserve all of the historical metrics data from all of ONOS instances.
Usage
We recommend the users to install influxDB in Ubuntu or CentOS.
In this installation guide, we will use CentOS 7 to install influxDB.
Prerequisites
Before you start, you will need followings:
- CentOS 7 64-bit
- 2GB or more RAM
- 2 or more processors
You can install CentOS 7 with minimum requirements.
InfluxDB Installation
In this step, we will install InfluxDB.
First update your CentOS to make sure that you have the latest software stacks installed.
$ sudo yum -y update
Add InfluxDB repository into yum.
$ cat <<EOF | sudo tee /etc/yum.repos.d/influxdb.repo
[influxdb]
name = InfluxDB Repository - RHEL \$releasever
baseurl = https://repos.influxdata.com/rhel/\$releasever/\$basearch/stable
enabled = 1
gpgcheck = 1
gpgkey = https://repos.influxdata.com/influxdb.key
EOF
Once repository is added to the yum configuration, try to install InfluxDB using yum install.
Note that ONOS supports InfluxDB up to 0.10.3. The InfluxDB which has higher version number will not work properly with ONOS.
The installation of InfluxDB with a specific version number can be done using following command.
$ sudo yum install -y influxdb-0.10.3-1.x86_64
You can try following commands to automatically start influxdb at OS boot time.
$ sudo chkconfig --level 2345 influxdb on
Finally, run InfluxDB.
$ sudo service influxdb start
InfluxDB Configuration
Connect to InfluxDB shell.
$ influx
In InfluxDB shell, create a new database with the name of "onos".
> CREATE DATABASE onos
Access InfluxDB web GUI to setup a new user. The URL of InfluxDB web GUI is http://ipaddress:8083/.
In connection settings, input the following information.
- Host: ip address where InfluxDB is installed
- Port: 8086
- Username: onos
- Password: onos.password
Now, we are ready to push the metrics from ONOS to InfluxDB!
Try out InfluxDB Report and Query Application
In this step, we will show how to use ONOS built-in application to report various metrics to InfluxDB.
First install and run ONOS instance. The detailed procedures can be refer from here.
After ONOS has been initialized, we can activate InfluxDB report and query application using following command.
onos > app activate org.onosproject.influxdbmetrics
By default, ONOS reports the metrics to localhost, and if your InfluxDB server runs externally, you have to specify the address of InfluxDB server.
Please replace <InfluxDB Address> with your own one.
onos > cfg set org.onosproject.influxdbmetrics.InfluxDbMetricsConfig address <InfluxDB Address>
Since metrics reporting occurs in each minute, you need to wait 1 minute to see the reported metric value from InfluxDB.
The metric value can be accessible through InfluxDB web GUI.
If the metric values are reported correctly, we will see followings in your InfluxDB web GUI.


