Due to a ransomware attack, the wiki was reverted to a July 2022 version. . We apologize for the lack of a more recent valid backup.
...
Web Graphic User Interface (GUI)
CPMan also provides a way to visualize the control metrics using bar/line chart.
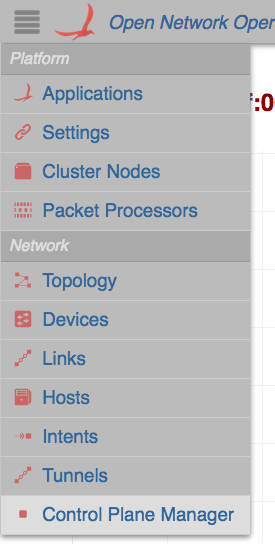
You can find the CPMan GUI under network category in ONOS GUI.
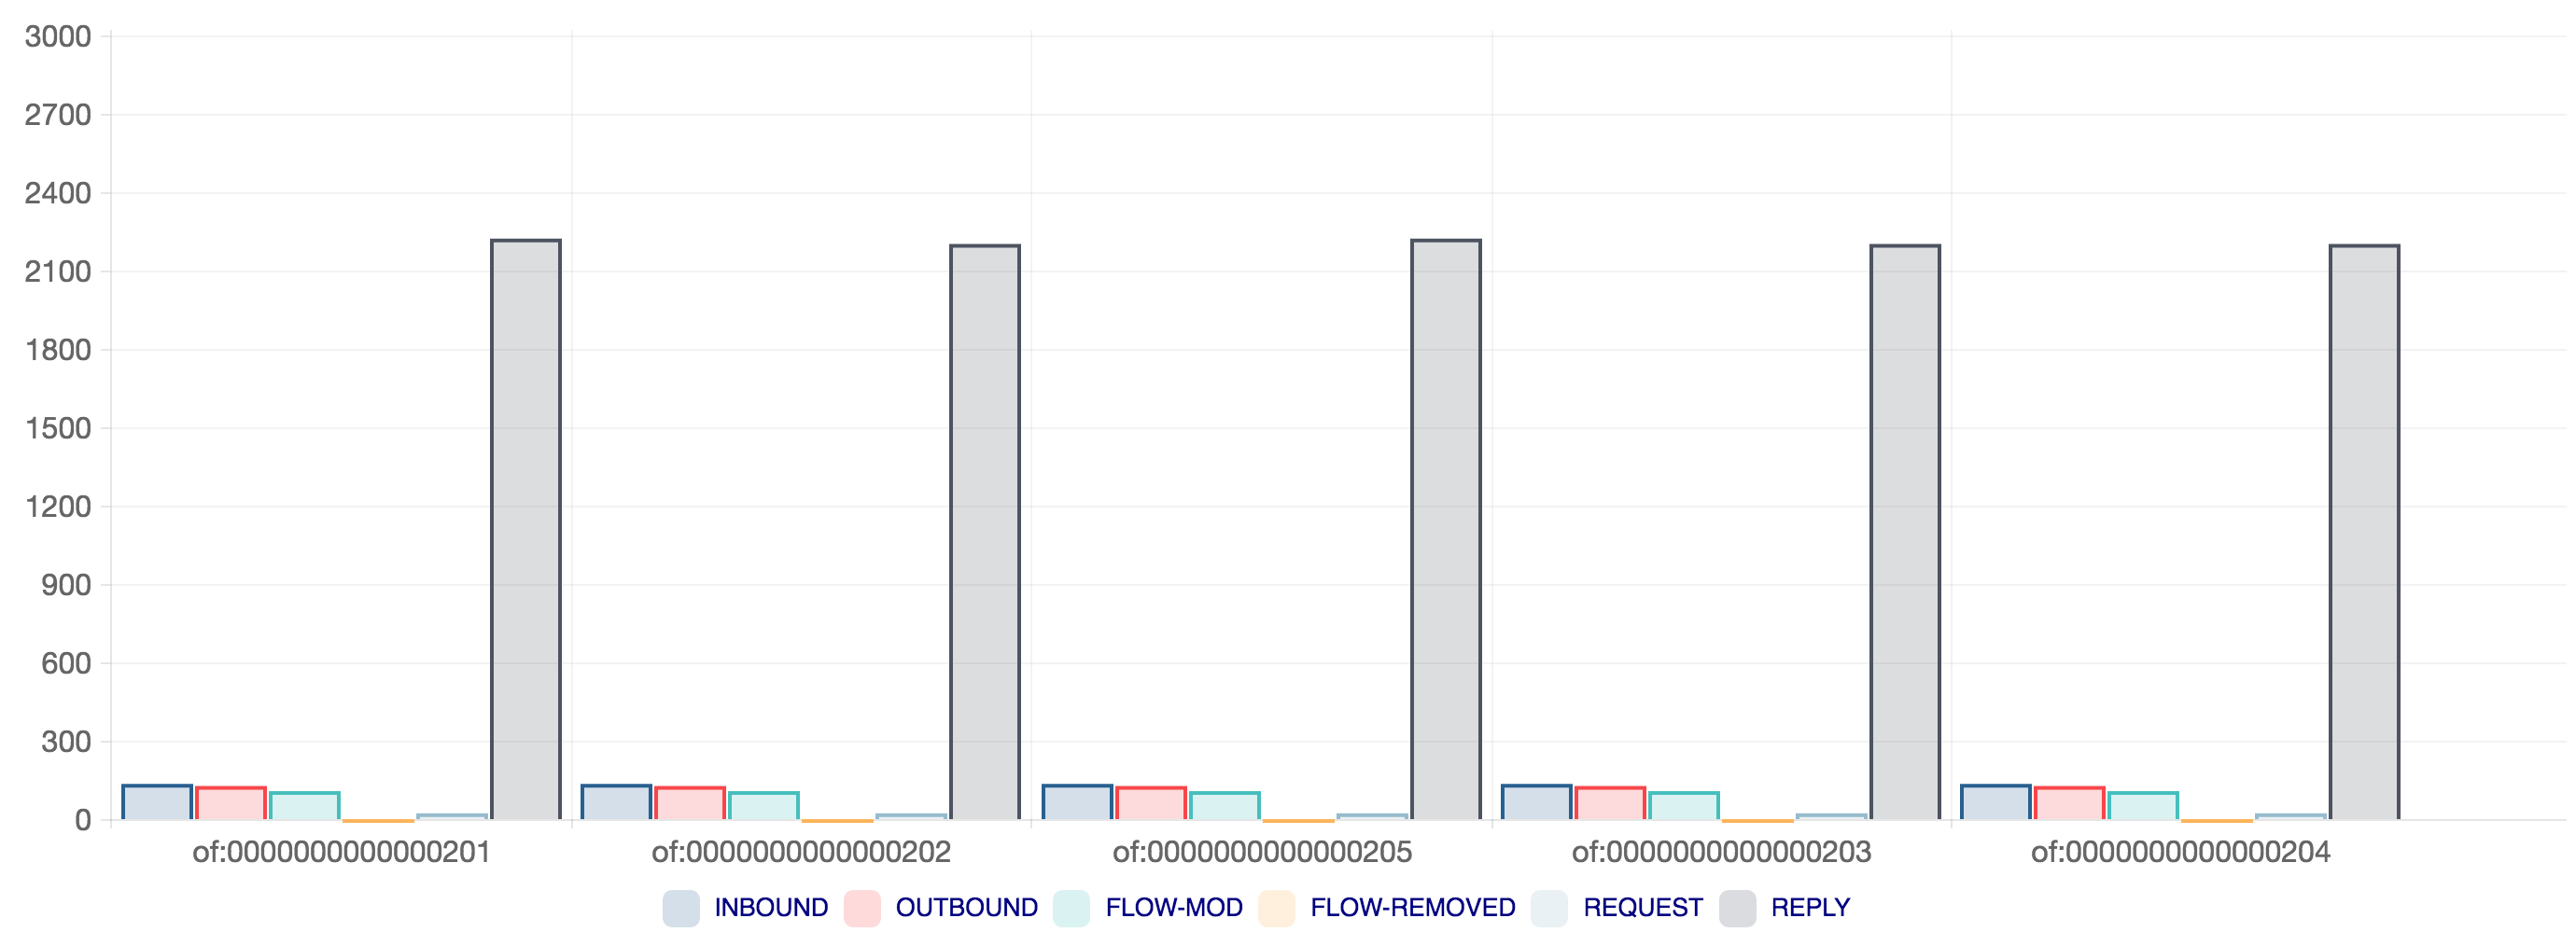
By default, CPMan shows a bar chart of control message stats. per device.
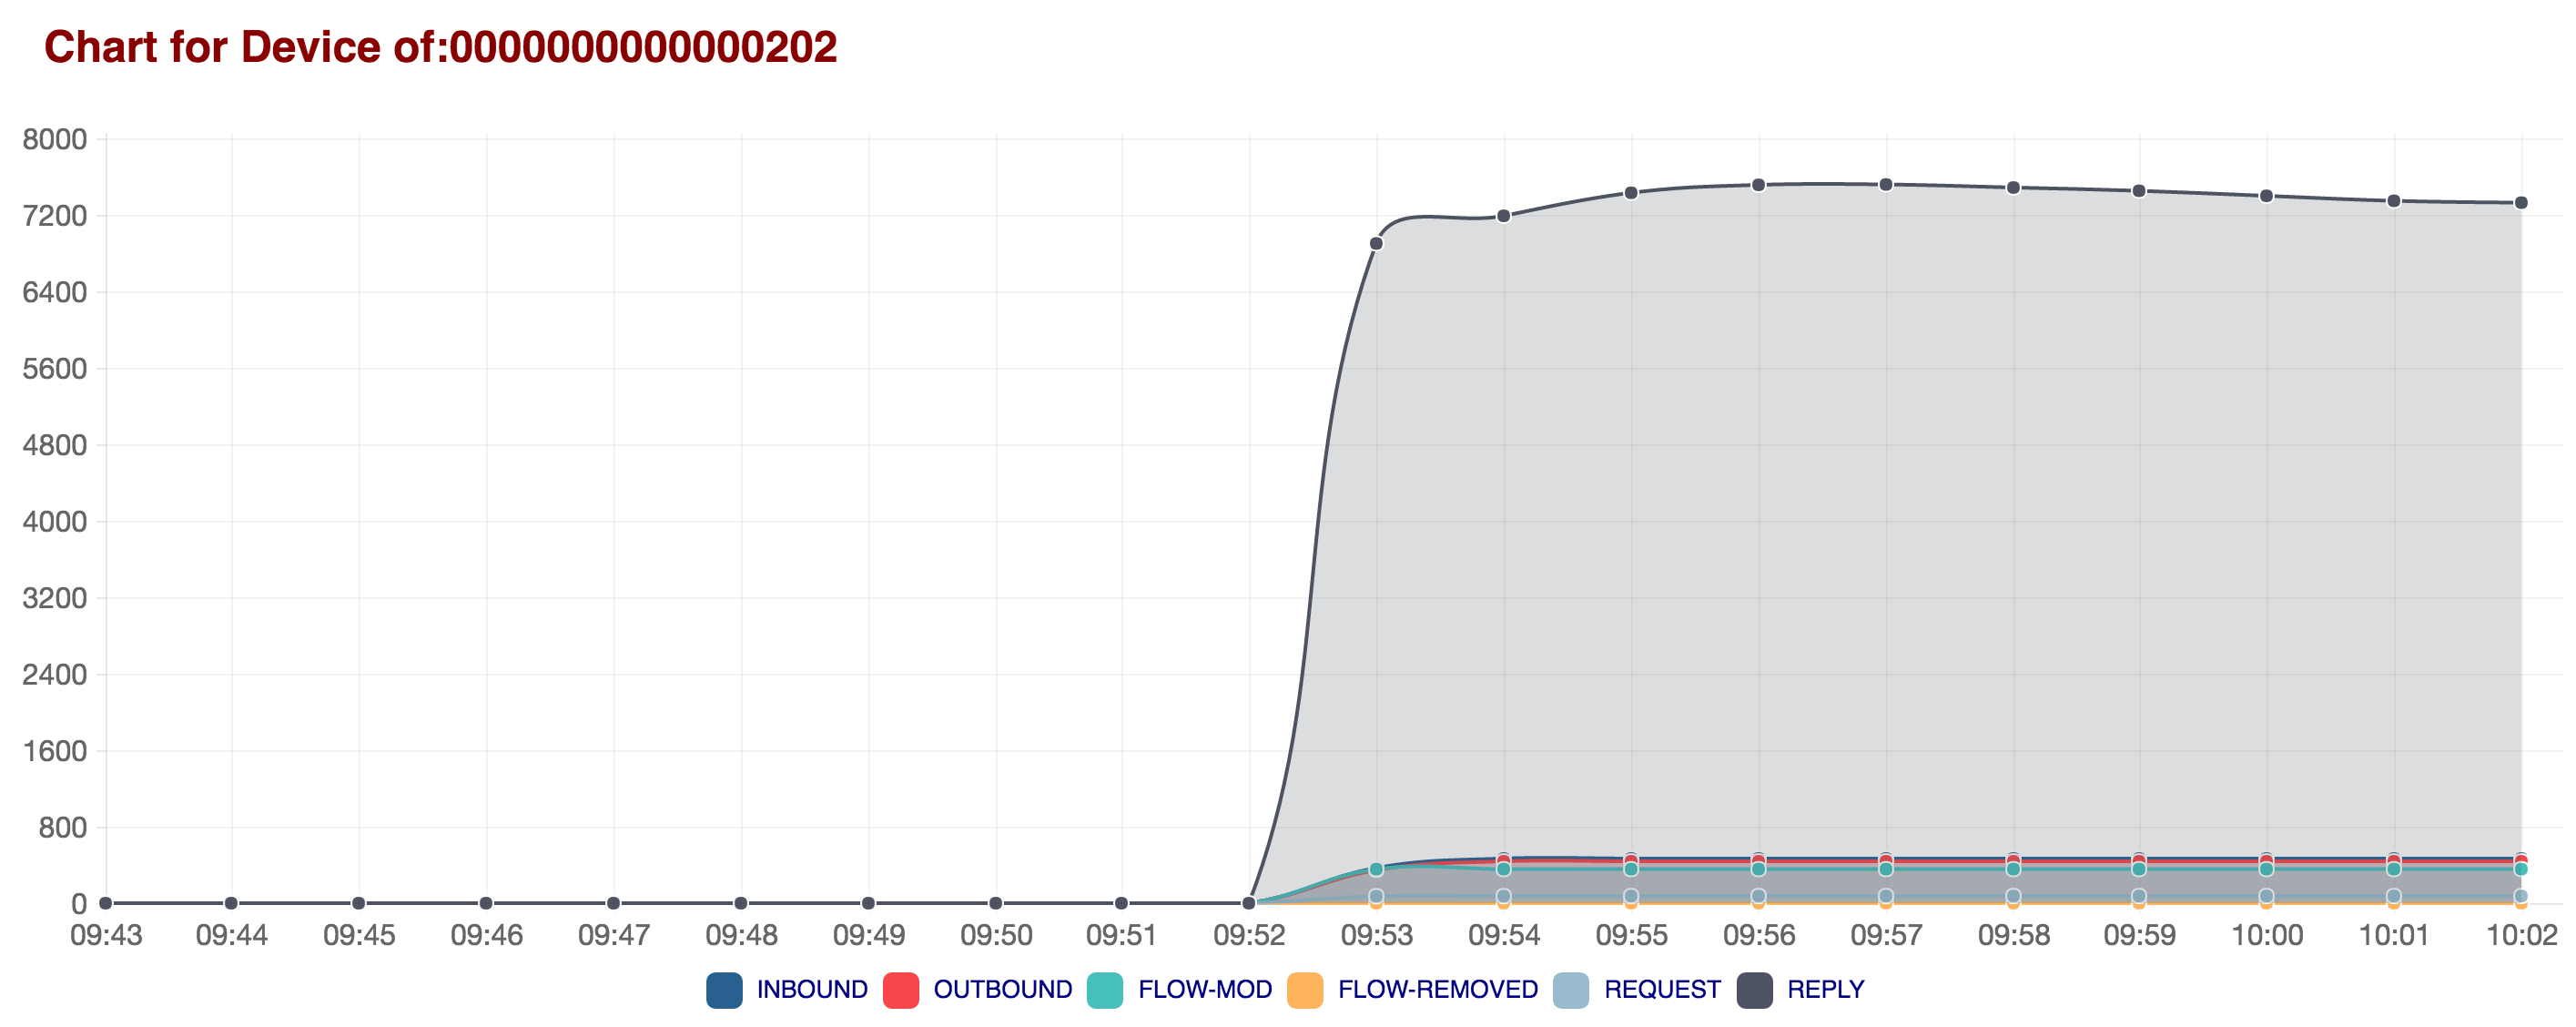
A detailed time-series line chart can be visualizable by clicking each bar chart.
Export Metrics to Third-party System
TBD
Appendix