Due to a ransomware attack, the wiki was reverted to a July 2022 version. . We apologize for the lack of a more recent valid backup.
...
Overlays bundled with out-of-the-box ONOS ; follow are listed here. Follow the links for functional descriptionsmore information:
- Traffic Overlay
- Maps Overlay (coming soon)
- ...
...
| Icon | Key | Function | Default State | Comments |
|---|---|---|---|---|
| I | Show / hide ONOS cluster instance panel | show | The instance panel is shown by default. | |
| O | Show / hide ONOS summary panel | show | The summary panel is shown by default. | |
| D | Disable / enable details panel | enable | The details panel is enabled by default, and is displayed when one or more topology elements are selected. Disabling this panel keeps it hidden even when something is selected. | |
| H | Toggle host visibility | hide | Shows or hides the hosts (and their links). Hosts are hidden by default. | |
| M | Toggle offline visibility | show | Devices that are offline (but that ONOS still knows about) are shown by default. This toggle will hide offline devices (and any hosts/links connected to them). | |
| P | Toggle port highlighting | on | Port highlighting is when hovering the mouse over a link will highlight the link and label the ends with the appropriate port numbers. This feature can be switched off with this toggle. | |
| B | Toggle background geo map | hide | The background map (hidden by default) can be shown or hidden with this toggle. | |
| G | Select background geo map | n/a | Opens a dialog box which allows selection of a geographic region from a pre-defined set. | |
| S | Toggle sprite layer | hide | The sprite layer (static shapes/text injected into the view) can be shown or hidden with this toggle. |
...
| Icon | Key | Description | Default State | Comments |
|---|---|---|---|---|
| Z | Toggle oblique view (experimental) | regular view | Creates a split-level visualization of the packet and optical layers of the network. Note that this feature is experimental and may be slightly buggy. | |
| N | Cycle node layers | show all layers | Cycles between three view modes: show all layers, show packet layer, show optical layer. | |
| L | Cycle device labels | hide labels | Cycles between three modes of showing labels on devices: hide labels, show friendly labels, show device ID. | |
| R | Reset pan / zoom | - | This function restores the pan and zoom levels to default settings. | |
| E | Equalize mastership roles | - | Sends a command to ONOS to invoke a mastership equalization request. | |
| No overlay | De-activates the current overlay. | |||
| Traffic overlay | Provides traffic monitoring functions. | |||
... | ... | <Topology Overlays installed by ONOS Apps will appear here> |
...
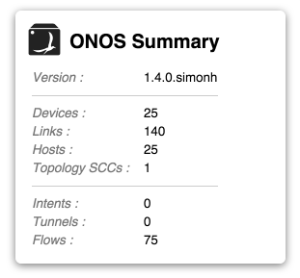
The panel can be hidden (and subsequently re-shown) by pressing the 'O' (for "ONOS summary") key.
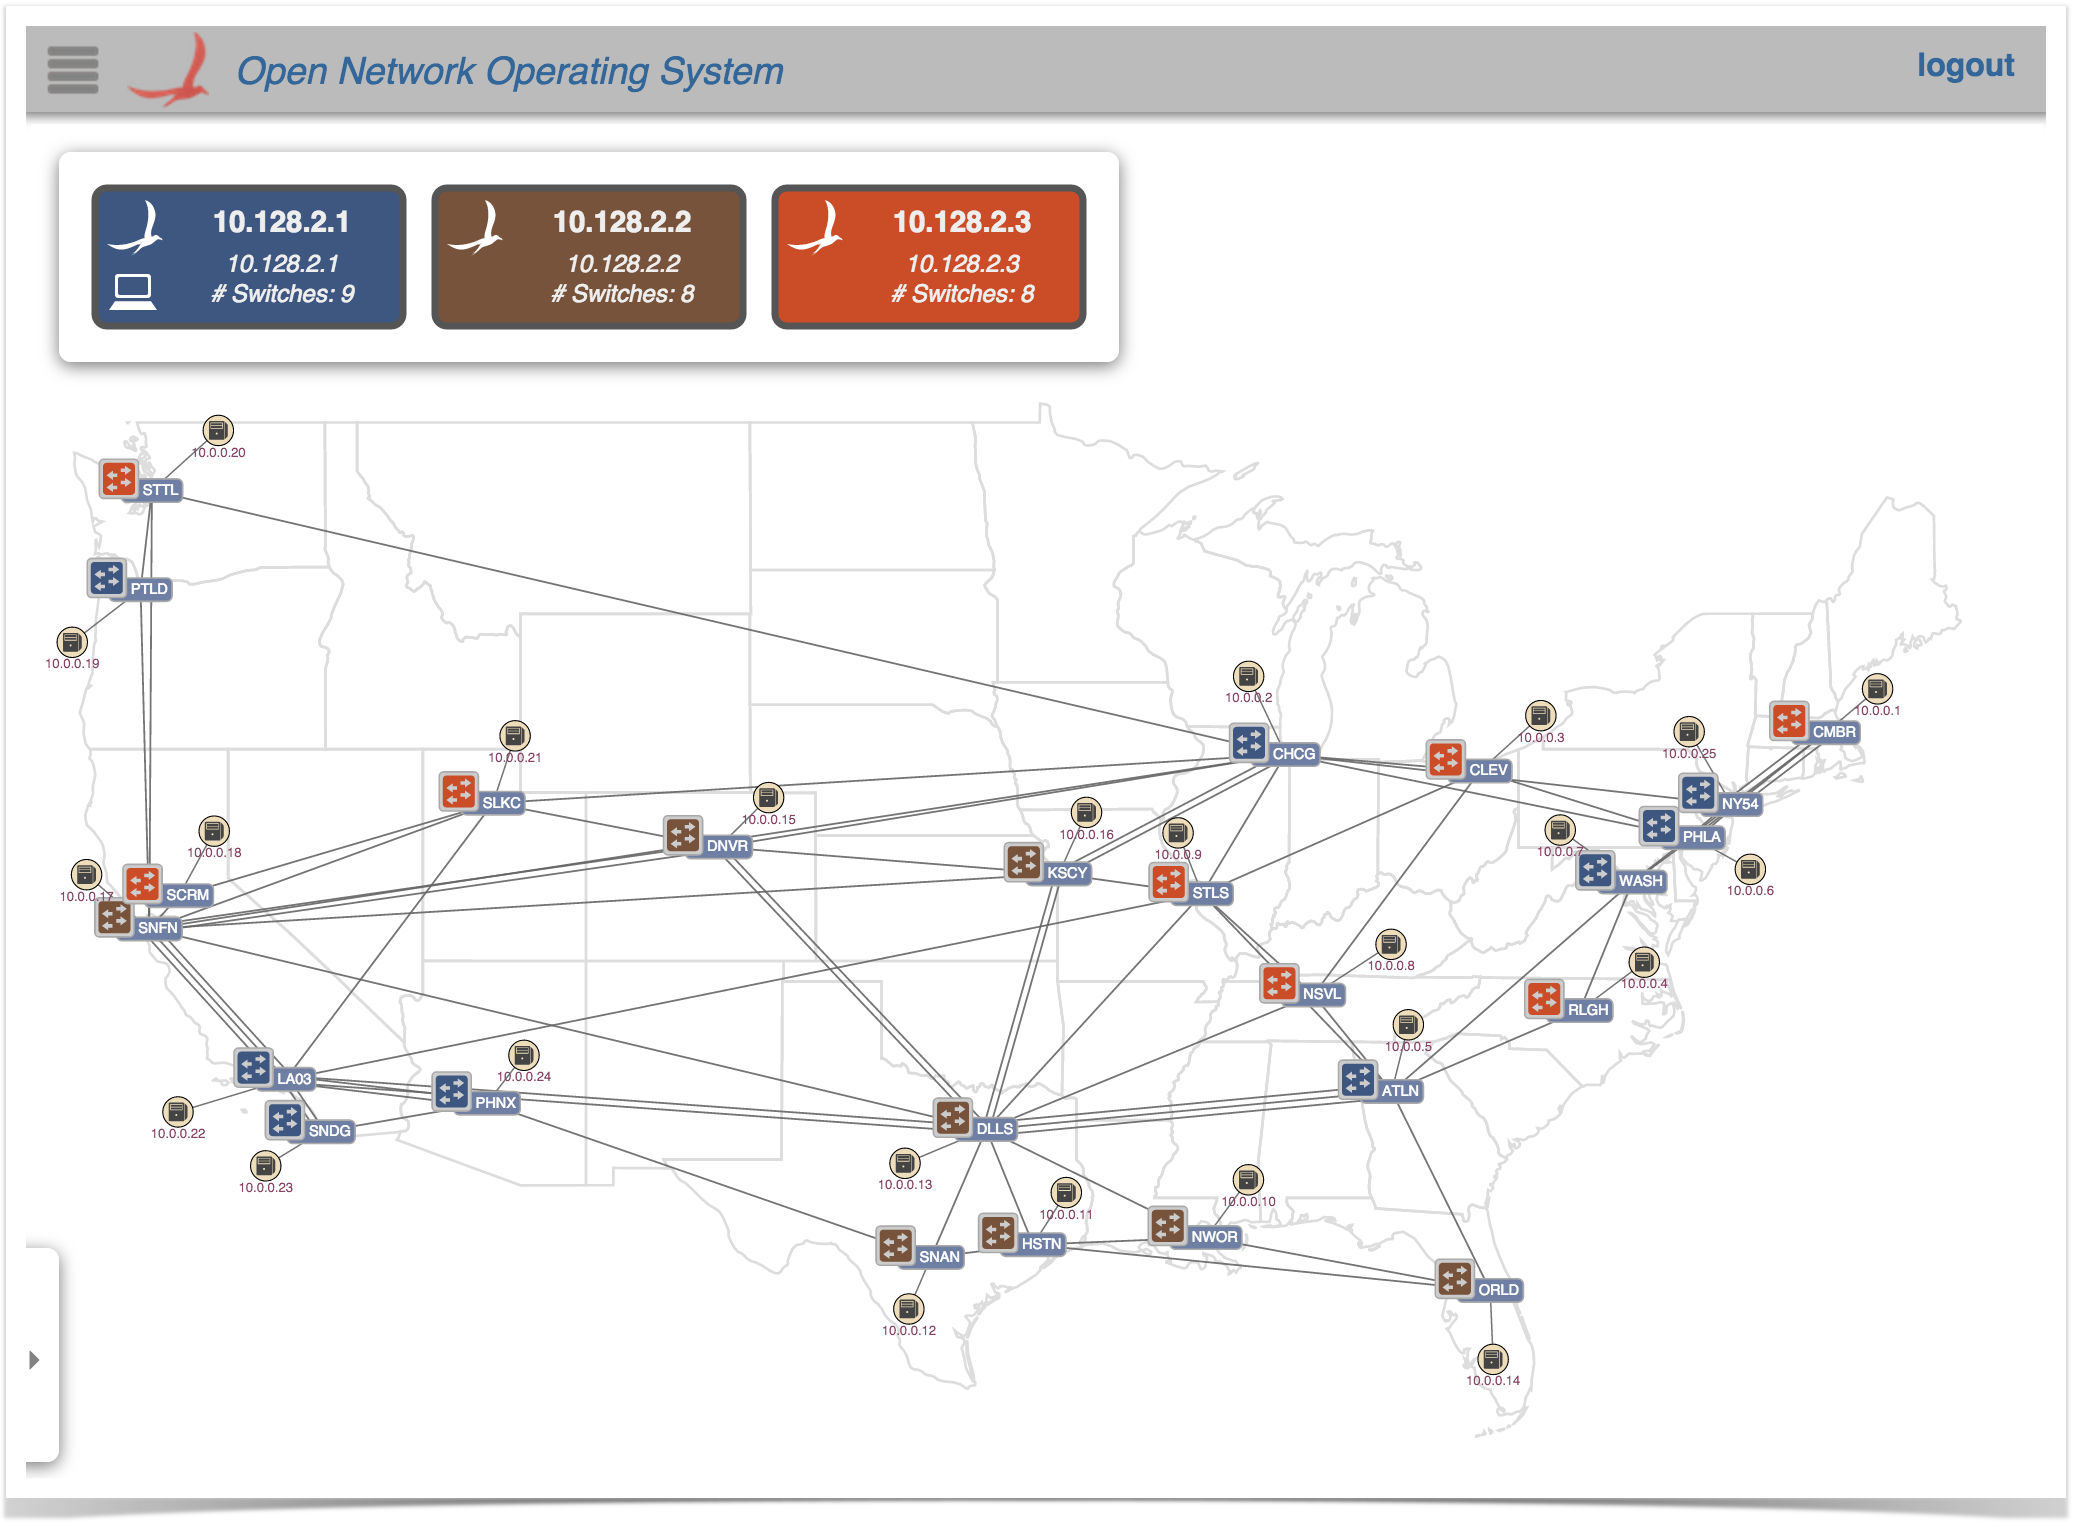
Nodes and Links
The network topology is represented by an undirected graph of nodes and links. The nodes represent devices (switches) and hosts; the links represent, uh, links.
...
Additionally, pressing the 'L' key will cycle through the devices labels ("friendly", "ID", "no-label"):
Mouse Gestures
A node (device / host) may be manually repositioned repositioned manually (and pinned into place) by clicking and dragging it to a new location.
NOTE: To unpin a pinned node, hover the mouse over the node and press the 'U' (UnpinUnpin) key.
Clicking on a node or link will select it (and deselect any other selections). Details of the selected node or link will appear in the details panel. Note that action buttons relating to the selection are may be provided at the bottom of the panel.
Multiple selections (nodes only, not links) may be achieved by holding down the Shift key while clicking on a node - this toggles the selection state of that node.
Pressing the Escape key Clicking elsewhere on the map or pressing the Esc key will clear the current selection.
Panning and zooming the topology is view may be achieved with Cmd-drag (or Alt-drag) and Cmd-scroll (or Alt-scroll) gestures respectively. Pressing the 'R' key will reset the pan/zoom settings to the default values.
Details Panel - Single Selections
The details panel appears (unless disabled with the 'D' command) when something of interest is "selected".
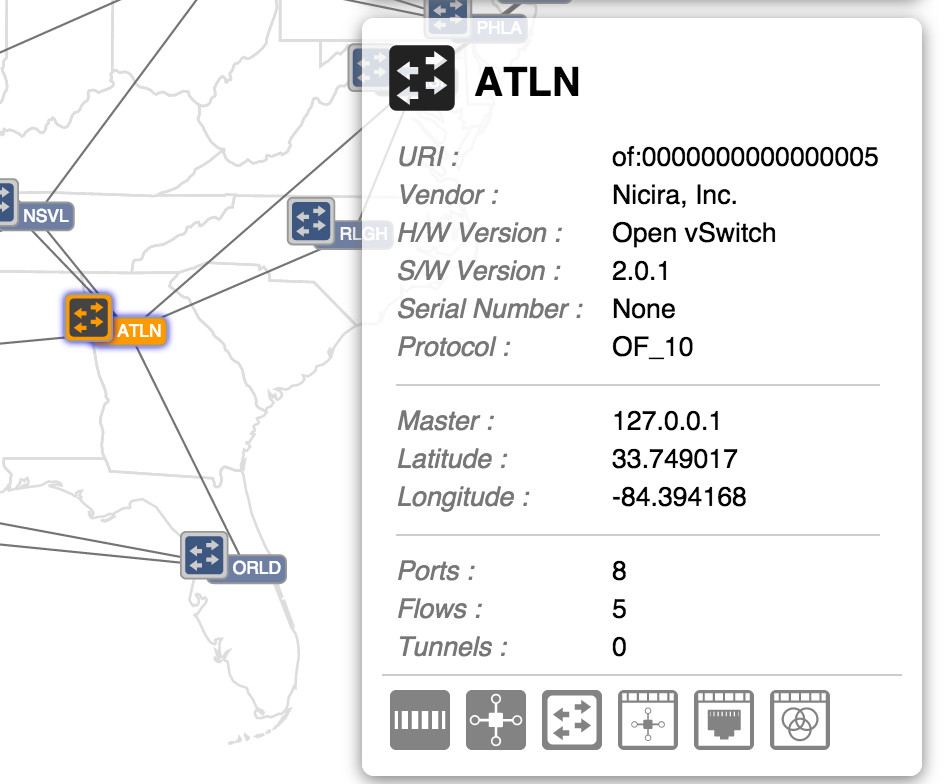
Device Selected
When a single device is selected, properties of that device are displayed, along with action buttons:
...
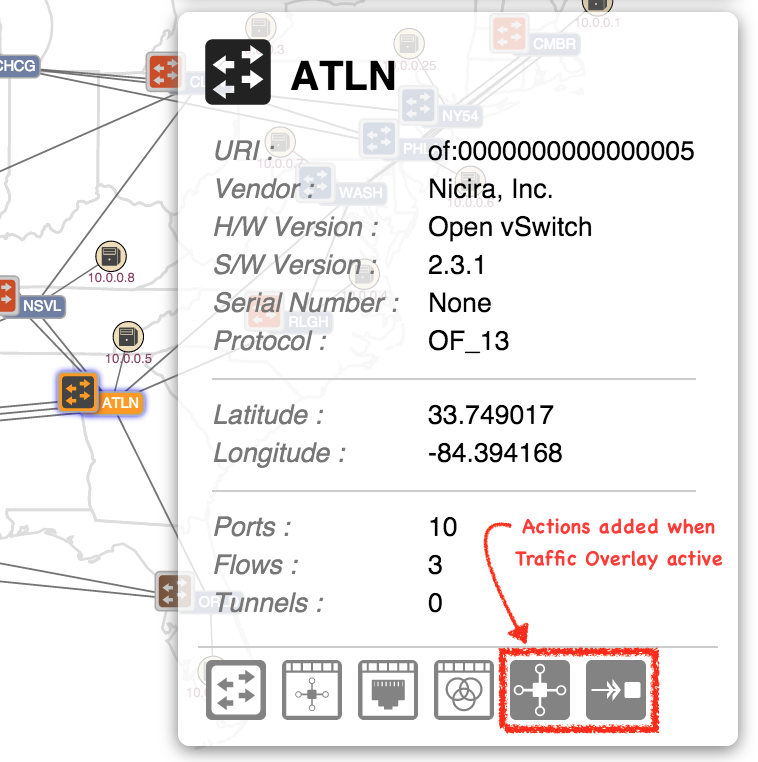
The four action buttons (with white backgrounds) are navigation buttons detailed below. The two action buttons on the right are added to the panel if the Traffic Overlay is currently active. See the Traffic Overlay page for details.
| Navigation Actions | |
|---|---|
| Navigate to the Device View for the selected device | |
| Navigate to the Flow View for the selected device | |
| Navigate to the Port View for the selected Device | |
| Navigate to the Group View for the selected Device | |
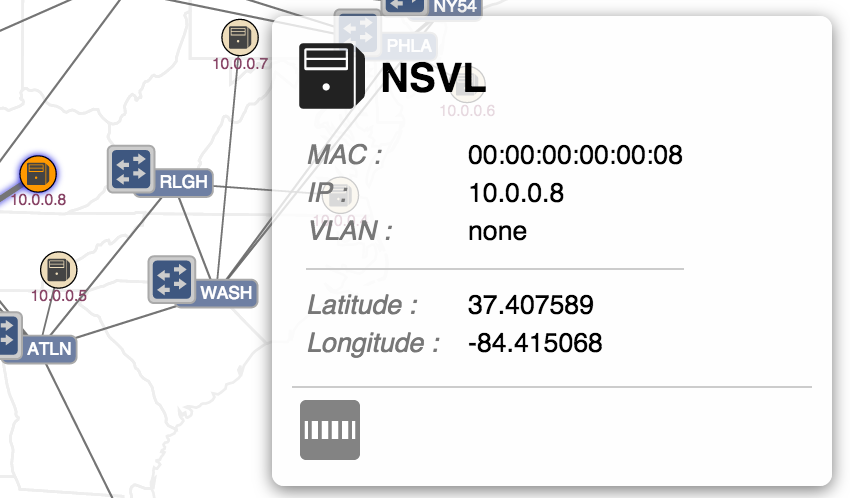
Host Selected
When a single host is selected, properties of that host are displayed.
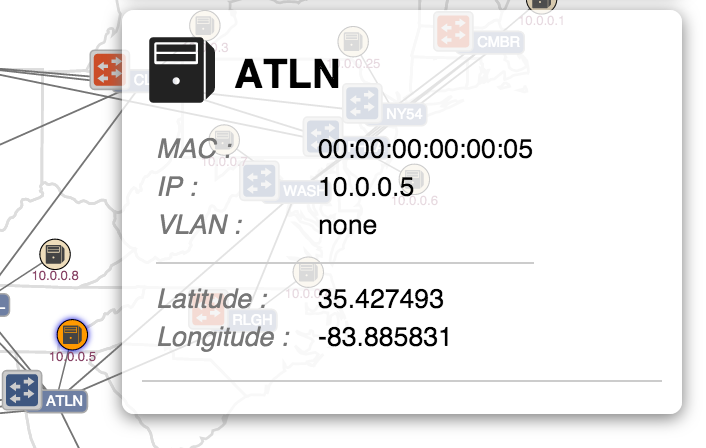
If an overlay is currently active, action buttons may also be displayed, depending on the overlay.
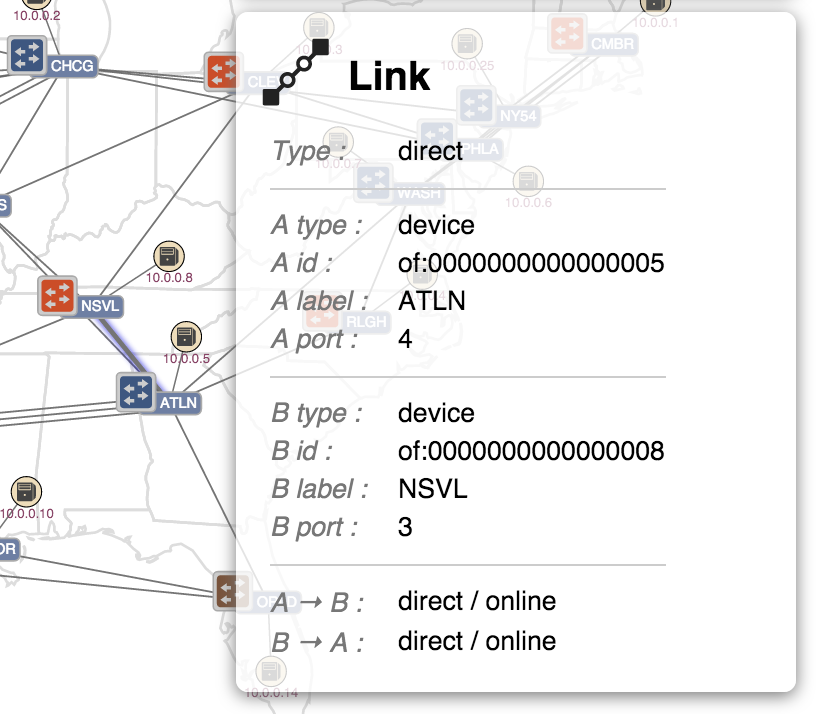
Link Selected
When a link
...
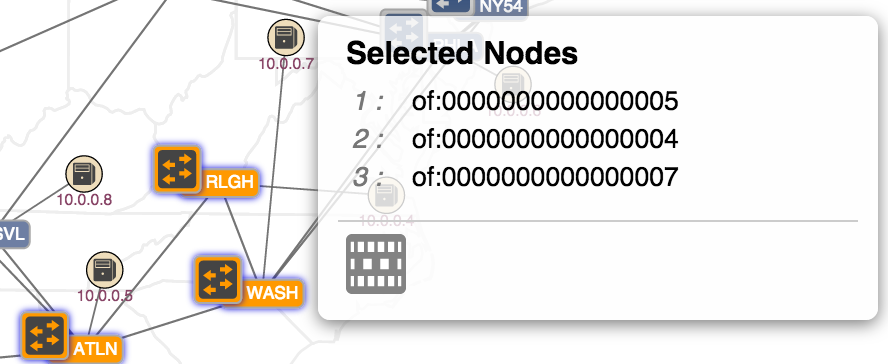
When multiple devices are selected, the details panel switches format to show the IDs of the selections and provides a single action button:
![]() Show Related Traffic
Show Related Traffic
When a single host is selected, properties of that host link are displayed, along with an action button:
![]() Show Related Traffic
Show Related Traffic
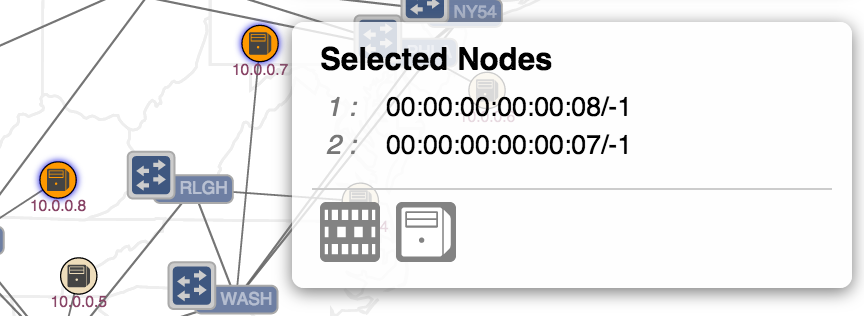
When exactly two hosts are selected, their IDs are shown, along with the following action buttons:
![]() Show Related Traffic
Show Related Traffic
![]() Create Host-to-Host Flow
Create Host-to-Host Flow
Note that it is not possible to select multiple links.
Details Panel - Multiple Selections
It is possible to select multiple nodes (devices / hosts) at the same time. In these cases the details panel lists the identities of the selected elements in the order of selection:
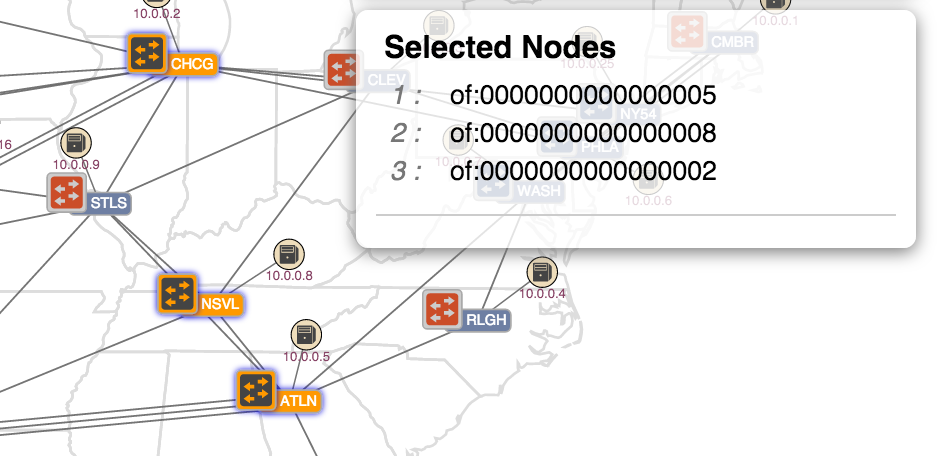
Action buttons may also be provided if the active overlay has functions that operate on a multi-selection.
Port Highlighting
By default, port highlighting is enabled, which means that as the mouse hovers over a link, the link highlights and the port numbers at both ends of the link are shown:
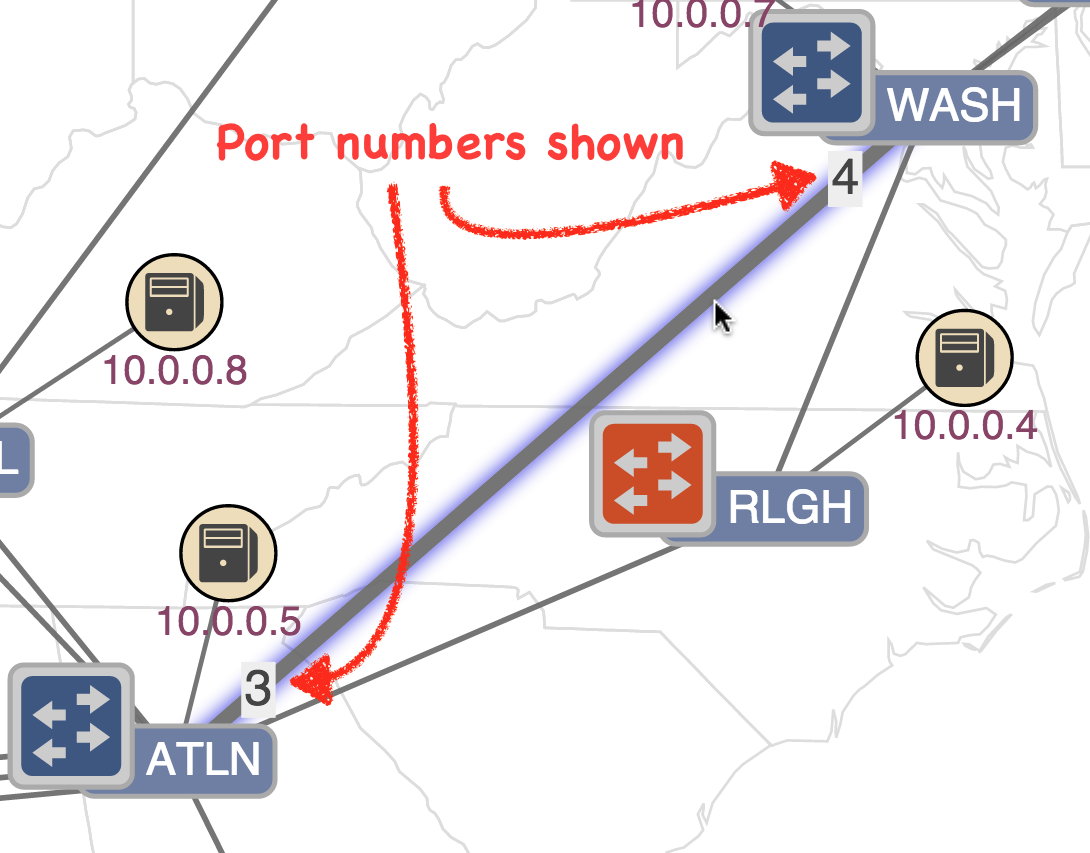
The port highlighting feature can be toggled on / off by pressing the 'P' (for 'Port highlighting') key.
| Warning |
|---|
The following section will be migrated to a new page real soon now!!!! |
Traffic Overlay functions
| Icon | Key | Description |
|---|---|---|
| V | Show all related intents | |
| Right Arrow | Show next related intent | |
| Left Arrow | Show previous related intent | |
| W | Monitor traffic of selected intent | |
| A | Monitor all traffic | |
| F | Show device link flows |
...
A number of commands allow different visualizations of traffic on the network.(NOTE: the section on visualizing traffic will be moved to a new page soon, once the functionality has been migrated to a "Traffic Overlay")traffic on the network.
All Traffic
If there is traffic flowing on the network (for example, if reactive forwarding is active, and a pingall is run on mininet), then pressing the 'A' key will display something like the following:
...
The background map provides a geographic reference for the topology. The default map is the Continental US. The map layer's visibility can be toggled on and off with the 'B' (for background) key.See Providing Alternate Maps for the Topology View for additional details.can be toggled on and off with the 'B' (for background) key.
See Providing Alternate Maps for the Topology View for additional details.
The scale of background map can be changed on demand. To do that, simply append ?mapscale=<real-number> at the end of the URL. For example,
| Panel |
|---|
http://localhost:8181/onos/ui/index.html#/topo?mapscale=1.5 |
Custom Sprites
The Topology Sprite Layer mechanism allows custom "background" elements to be displayed (above the background map, but below the topology elements). This could be used, for example, to inject labeled "subnet clouds", or the plan of an office building or campus into the topology view. Typically, one would want to hide the background map layer (press 'B') and show the sprite layer (press 'S') instead.
...