Due to a ransomware attack, the wiki was reverted to a July 2022 version. . We apologize for the lack of a more recent valid backup.
...
| Abstracted Message Type | OpenFlow Message Type |
|---|---|
| INBOUND_PACKET | PACKET_IN |
| OUTBOUND_PACKET | PACKET_OUT |
| FLOW_MOD_PACKET | FLOW_MOD |
| FLOW_REMOVED_PACKET | FLOW_REMOVED |
| REQUEST_PACKET | STATS_REQUEST |
| REPLY_PACKET | STATS_REPLY |
Usage
Installation
Before you start, you will need followings:
- Ubuntu 14.04 64-bit
- 2GB or more RAM
- 2 or more processors
ONOS, mininet Installation and CPMan Activation
Install and run ONOS instance. The detailed procedures can be refer from here.
...
If you want to collect system metrics (e.g., CPU, memory usages, disk I/O, etc.), please refer to this link.
Usage
Command Line Interface (CLI)
The statistics information of control metrics can be queried through CLI.
In ONOS console, you can type following command to view control message stats.
| Code Block | ||
|---|---|---|
| ||
onos > cpman-stats-list <node_ip> control_message <device_id> |
You also can query other control metrics by specifying the control metric type such as cpu, memory, disk, network, etc.
REST API
We also provide a way to query and collect control metrics through REST API.
Followings are the REST API for collecting and querying control metrics.
Collector
| POST /collector/cpu_metrics | Collects CPU metrics. |
| POST /collector/network_metrics | Collects network I/O metrics include in/out-bound packets/bytes statistics. |
| POST /collector/disk_metrics | Collects disk I/O metrics include read and write bytes. |
| POST /collector/system_info | Collects system information. |
| POST /collector/memory_metrics | Collects memory metrics. |
Control Metrics
| GET /controlmetrics/memory_metrics | List memory metrics of all network resources. |
| GET /controlmetrics/messages | List control message metrics of all devices. |
| GET /controlmetrics/messages/{deviceId} | List control message metrics of a given device. |
| GET /controlmetrics/cpu_metrics | List CPU metrics. |
| GET /controlmetrics/disk_metrics | List disk metrics of all disk resources. |
Web Graphic User Interface (GUI)
CPMan also provides a way to visualize the control metrics using bar/line chart.
You can find the CPMan GUI under network category in ONOS GUI.
Terminology
TBD
...
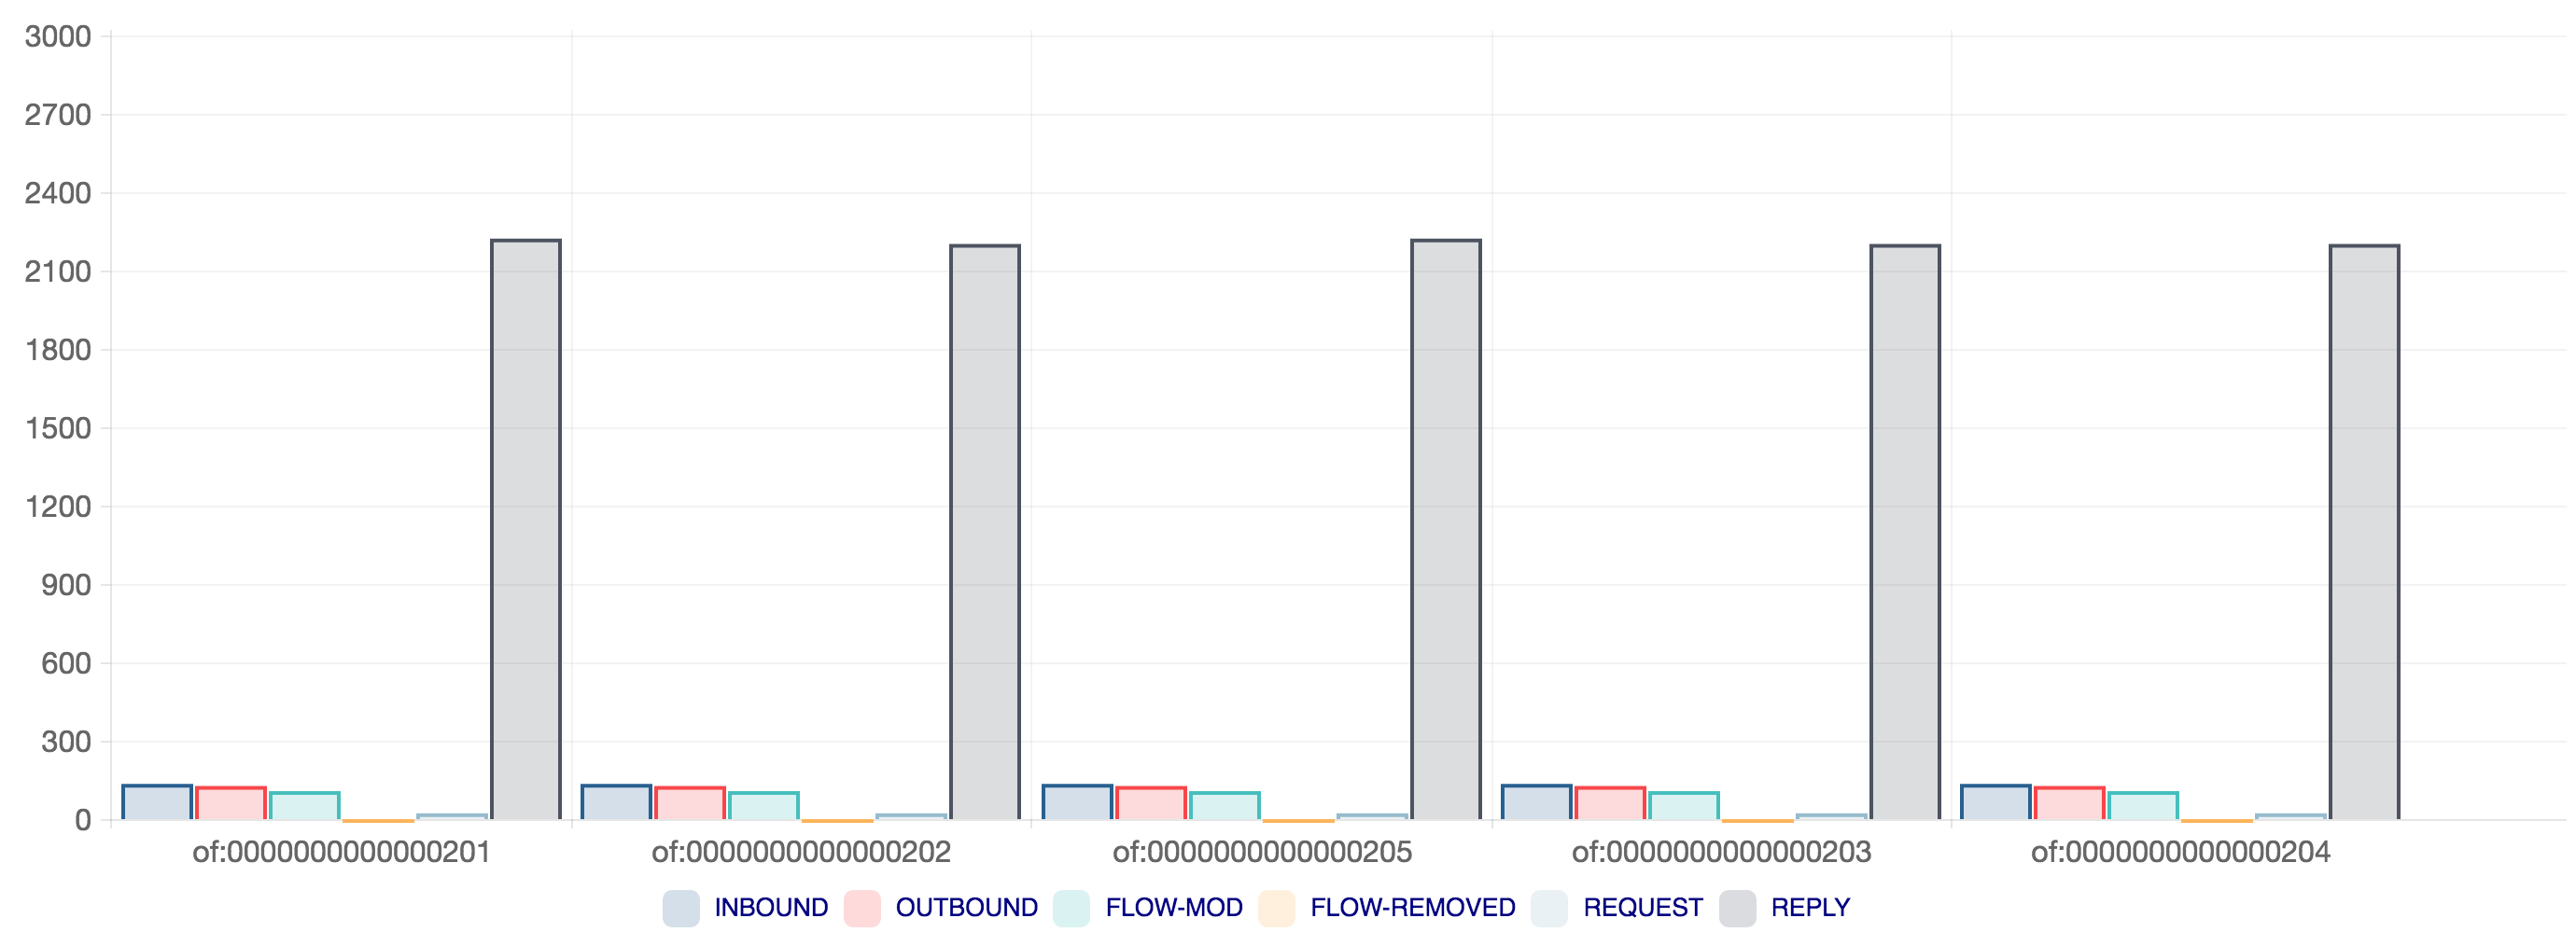
By default, CPMan shows a bar chart of control message stats. per device.
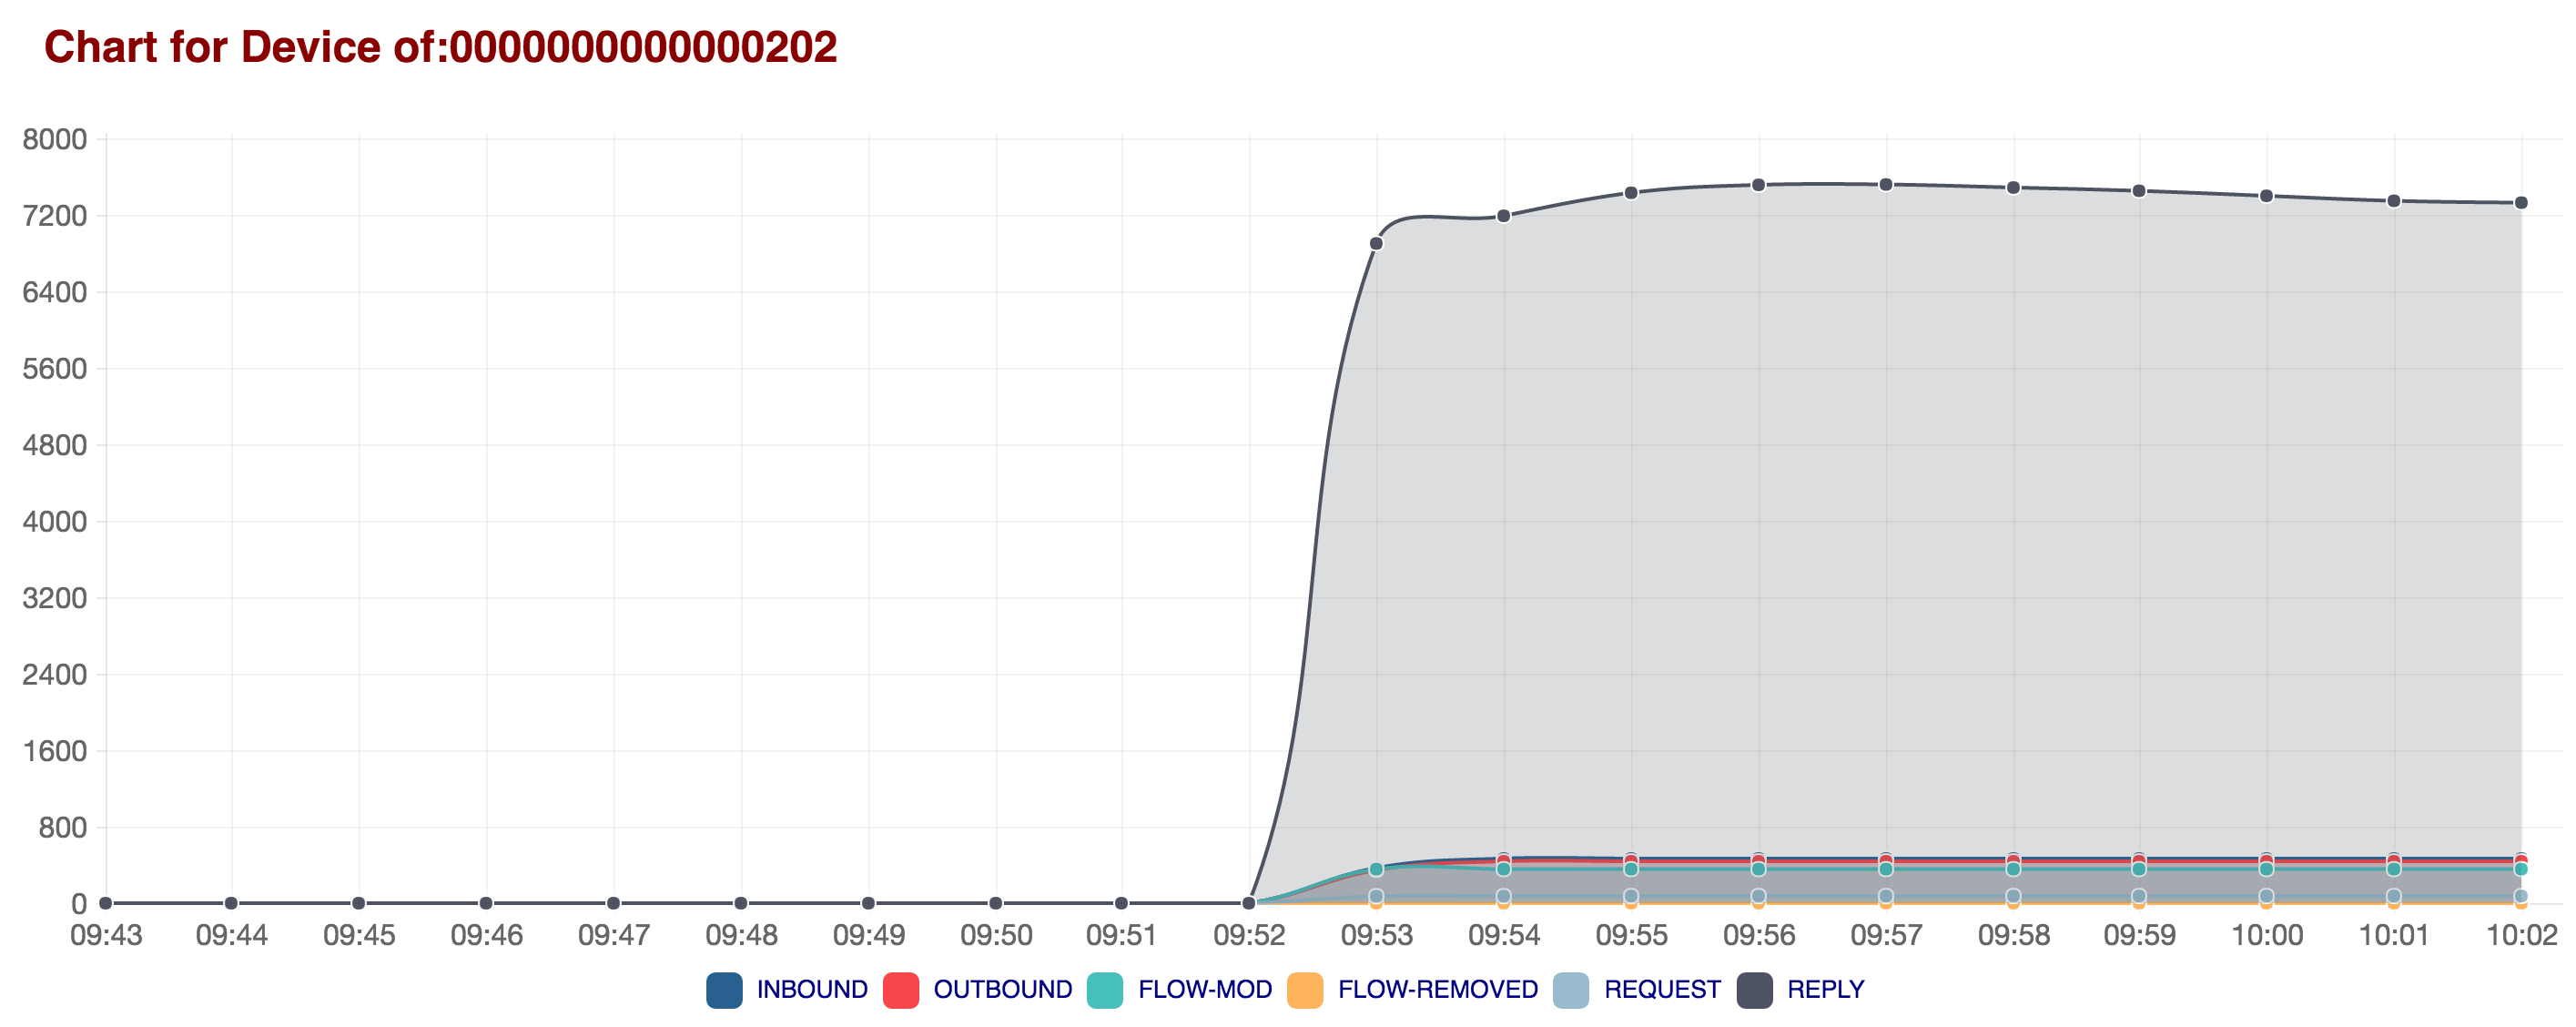
A detailed time-series line chart can be visualizable by clicking each bar chart.
Export Metrics to Third-party System
If you already have your own monitoring system, you may want to export ONOS control metrics to third-party system.
ONOS provides two ways to support metrics export.
The first way is pull based approach with which you need to periodically pull the control metrics from your system through ONOS REST API.
The detailed REST API can be referred from this link.
The second way is push based approach with which ONOS periodically reports a set of control metrics to predefined third-party system.
By far, ONOS supports three systems and those are InfluxDB, ganglia and graphite monitoring system.
The detailed explanation on exporting the metrics to those system can be referred from following links.
Appendix