Due to a ransomware attack, the wiki was reverted to a July 2022 version. . We apologize for the lack of a more recent valid backup.
...
| Code Block | ||
|---|---|---|
| ||
$ sudo yum -y install ganglia ganglia-gmond ganglia-gmond-python ganglia-web |
Ganglia Configuration
Edit /etc/ganglia/gmond.conf, comment out mcast_join and bind to only allow using unicast to report metrics data.
Edit /etc/httpd/conf.d/ganglia.conf, replace the configuration with following settings.
| Code Block | ||
|---|---|---|
| ||
<Location /ganglia>
  Allow from all
  Require all granted
</Location> |
Fix the permission and ownership of rrds directory using following commands.
| Code Block | ||
|---|---|---|
| ||
$ sudo chown -R ganglia:nobody /var/lib/ganglia/rrds
$ sudo chmod -R 775 /var/lib/ganglia/rrds |
Disable SELinux by changing the keyword "enforcing" to "disabled" in /etc/sysconfig/selinux, you need to restart the system to apply changes.
Start gmond, gmetad and apache web server.
| Code Block | ||
|---|---|---|
| ||
$ sudo service gmond start
$ sudo service gmetad start
$ sudo service httpd start |
You can try following commands to automatically start ganglia and web server at OS boot time.
| Code Block | ||
|---|---|---|
| ||
$ sudo chkconfig --level 2345 gmond on
$ sudo chkconfig --level 2345 gmetad on
$ sudo chkconfig --level 2345 httpd on |
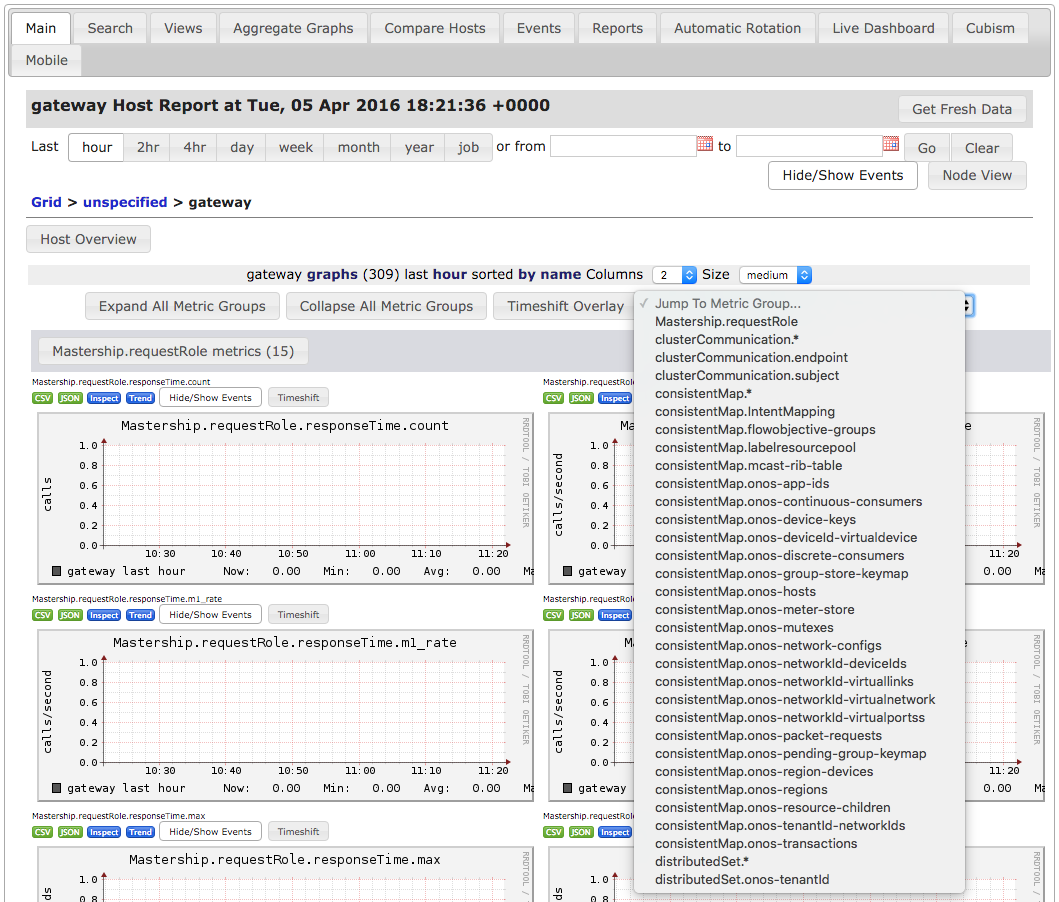
After done this, we can access ganglia web front-end to see the monitored result.
The address of ganglia web front-end is http://<server address>/gangliaTBD
Try out Ganglia Report and Query Application
...
| Code Block | ||
|---|---|---|
| ||
onos > cfg set org.onosproject.gangliametrics.GangliaMetricsReporterDefaultGangliaMetricsReporter address <Ganglia Address> |
Since metrics reporting occurs in each minute, you need to wait 1 minute to see the reported metric value from ganglia.
The metric value can be accessible through ganglia web GUI.
If the metric values are reported correctly, you will see gateway host with ONOS own reported metrics.