Due to a ransomware attack, the wiki was reverted to a July 2022 version. . We apologize for the lack of a more recent valid backup.
Description
This test is described in more detail in the following links, which we refer to:
Test plan: Experiment F Plan - Flow Subsystem Burst Throughput
Test result: Master: Experiment F - Flow Subsystem Burst Throughput
The difference is that we use the IXIA tester to simulate openflow switches, total 100 switches was set and 100000 flows for each switch, the results show below.
Test Results
Flow_mode Rate
Flow_mode rate(P/S)
Single mode(ONOS)
Flow_mode rate(P/S)
Three mode(ONOS1)
Flow_mode rate(P/S)
Three mode(ONOS2)
Flow_mode rate(P/S)
Three mode(ONOS3)
First 10760 13112 12569 8941 Second 11414 8383 7865 11244 Third 11892 8558 7376 8477 Fourth 12029 7983 7790 9028 Fifth 12174 13387 13087 7666 Sixth 11319 9126 8905 8335 Seventh 11225 14442 13546 7906 Eighth 12585 10446 9748 12318 Ninth 12065 10456 9878 8406 Tenth 10413 9638 9237 13580 Avg 11587 10553 10000 9590 Std 644 2188 2165 1939
- Histogram of Flow_mod rate

- Histogram of Flow_mod std
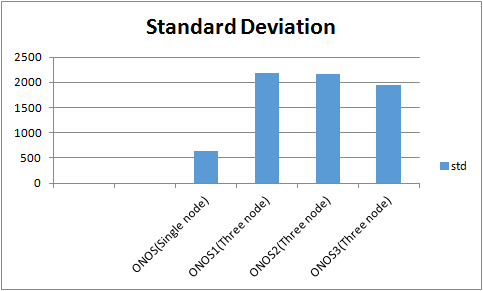
As the histograms show, in the case of three nodes, flow_mod is three times the case of a single node, but the standard deviation is much higher than single node.