The Meter View provides a top level listing of the meters a chosen device belongs to. Meters are displayed in tabular form.
Each row in the table is a single meter on the device. To see more meters, scroll down inside the table body.
Navigating to the Meter View
You can get to the Meter View in a few ways, although it is not on the main navigation menu.
Topology View
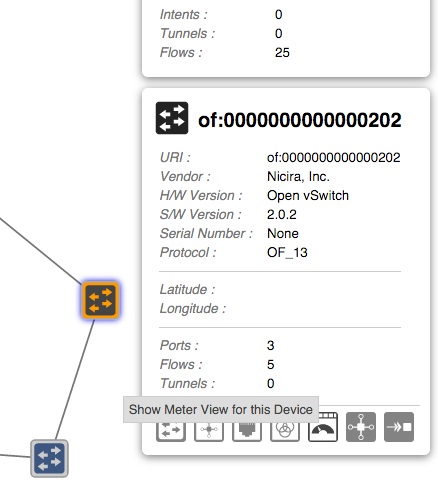
To get to the meters view for a certain device on the Topology View, select a device, make sure the Details Pane is enabled, and click on the button as shown below:
This will navigate you to the meter table for the device you have selected.
Device View
To get to the meters table from the Device View, select a device (row) of the table to have the details panel appear. To get to the meters view, click on the button as shown below:
This will navigate you to the meter table for the device you have selected.
Query String via URL
You can also get to the meters view for a specific device by altering the query string in the URL.
The URL format for the meters table is:
http://<HOST>:<PORT>/onos/ui/index.html#/meter?devId=<DEVICE URI>
Notice that the end of the URL contains query parameters. If you choose to navigate to the meters view directly, type in the device's URI after ?devId=.
For example, to get to meters table for the device with the URI "of:0000000000000002" while using the domain localhost and the default port, use the URL:
http://localhost:8181/onos/ui/index.html#/meter?devId=of:0000000000000002
Header
The header of the Meter View will tell you which device's meters you are currently viewing, with how many meters there are in total on that device.
Table Body
Column Headers
The column headers for each section in the table are sortable (see tabular view page). By default, the meters are sorted in ascending order by Meter ID. You can toggle between ascending and descending on any header.


